
The use of the Ichimoku Kinko Hyo can be traced to the 1940s, when a journalist known as Goichi Hosoda (using the pseudonym Ichimoku Sanjin) began to work on a new method of technical analysis. His method was eventually published in 1968, giving birth to the indicator known today as the Ichimoku Kinko Hyo.
This indicator has several components, but the most prominent of these is the shaded area of the indicator known as the Kumo or cloud. The beauty of the indicator lies in its pliability and dexterity of usage, as every component of the Ichimoku indicator can be used to detect trading strategies. This article specifically deals with the cloud component, and the various ways in which it can be interpreted.
This article aims to interpret the use of the Kumo or cloud in various aspects of trading. Here are the ways in which the Kumo can be used.
The cloud can be used as a tool for detecting support and resistance. Usually, this involves using the positioning of the price candles/bars relative to the Kumo, and using the Kumo either as support (if price is in an uptrend) or a resistance (if price is in a downtrend).
It is always the best practice to wait for the candles or bars to close, to determine whether a price correction has translated into a reversal or not.
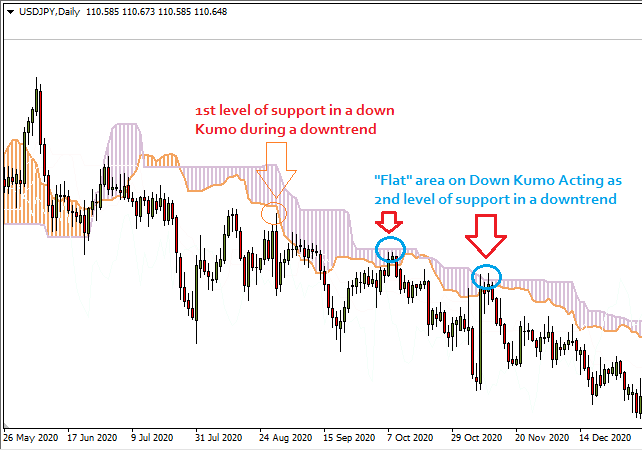
This brings us to the concept of the bull clouds and the bear clouds. On your charting package, you will see the bear clouds as being red or orange by default, and the bull clouds as having a cyan or green colour. On the bear clouds, the top of the cloud occasionally flattens to form the “bear flats.” On the bull cloud, the bottom of the cloud occasionally flattens to form the “bull flats.” Support and resistance on the Kumo depends on price behavior at the flats.
The flats in this case, usually act as the 2nd line of support/resistance. So whenever price breaks into the cloud (depending on the trend), a bounce on the flat area of the Kumo should confirm those areas as support and resistance areas.
If the price has cleared either the second support/resistance level after entering the cloud, you need to watch for potential signs of reversal. Any upcoming reversals can be spotted early if there are reversal candlesticks on the daily chart.
When trading with the Kumo, it is important to note how thick the cloud is. The thicker the cloud, the more difficult it will be for price to go through it. Price breaks that produce reversals are more prone to occur when the cloud is thin. In this instance, the position of the Senkou Span lines is insignificant.
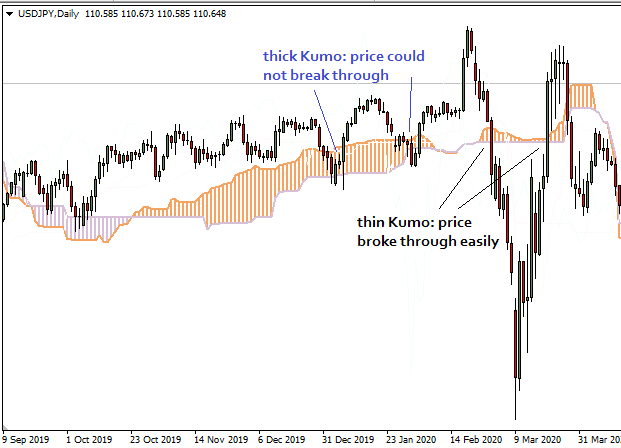
As you can see from the snapshot above, a thinner Kumo segment gives the price a better opportunity to break right through, initiating a trend reversal in the process. So when the cloud starts to thin out, watch carefully: a reversal may be in the offing. In the same vein, when the cloud starts to get thicker, you are more likely not to get a reversal.
As is usually the case, the use of the candlestick patterns to indicate what the speculators are doing is an invaluable addition to this Kumo use case. Remember, the candlesticks or price bars indicate what traders are doing in the markets.
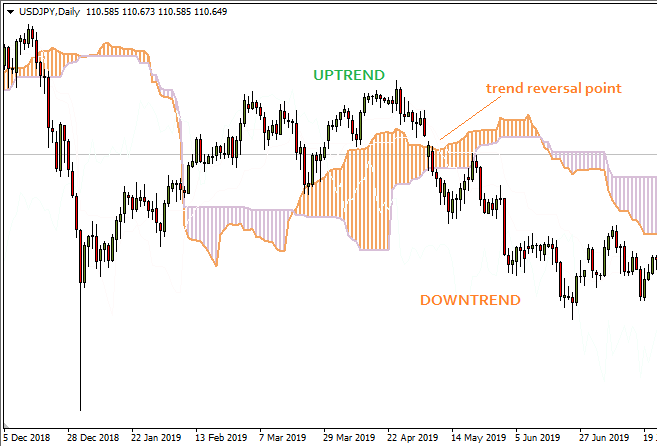
The snapshot shows price in an uptrend (i.e. price above the Kumo), the break of the Kumo in a downward direction, thereby signaling a trend reversal. Notice the outside day candle that triggered the reversal, following the bearish gap.
You can also look at a sequence of clouds and tell whether the clouds are shrinking or expanding. Shrinking clouds are a sign that the pre-existing trend is almost exhausted. Expanding clouds are a sign that the trend is about to pick up. Expanding clouds tend to follow a period of consolidation, which is when you see alternating clouds of roughly the same size with price stuck in the clouds and essentially going nowhere.
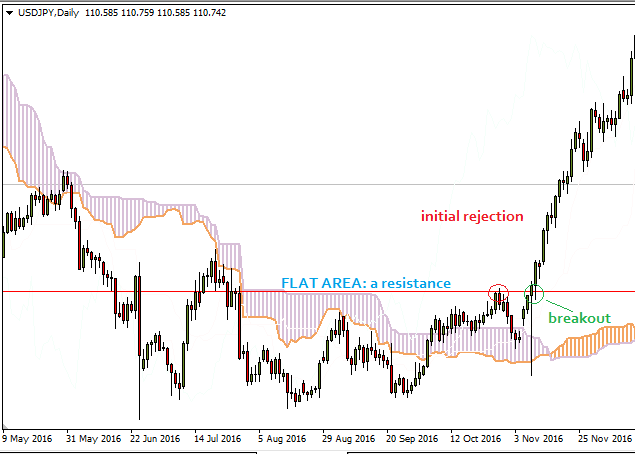
Following a price reversal, there is always the potential that the new trend will experience a resistance or support along the way as it tries to establish a new trend. You can use a previous Kumo flat to delineate the possible areas where this could happen.
In the chart below, we can see a previous down Kumo flat area serving as a prior support. Price was initially beaten back at this price area, before a new test of that price level resulted in a breakout.
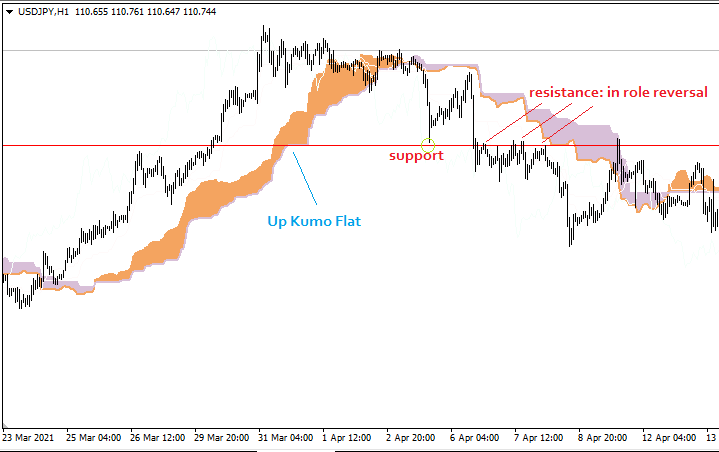
In a similar vein, the Up Kumo flat area can serve as a period where price may find support, or if acting in the case of a role reversal, can also function as a resistance level. This scenario Is showcased below in the chart where such a setup occurred.
The snapshot below shows the Up Kumo Flat at 31 March 2021, later serving as a support area on which price bounced initially in early March, before this area was broken. By 6 April and 7 April, the broken price level had undergone role reversal and acted like a resistance on several occasions, before price eventually continued downwards.
This latter strategy can prove invaluable to traders looking for opportunities on an intraday level.
This has been an interpretation of the cloud component of the Ichimoku Kinko Hyo indicator. With traders being able to see how the Kumo could be used, it could lead them to generate suitable trades. A knowledge of candlestick patterns is also fundamental to executing these trades properly.


