Candlesticks are a way of that the price activity of buyers and sellers are depicted on the charts, using shapes that look like candlesticks.
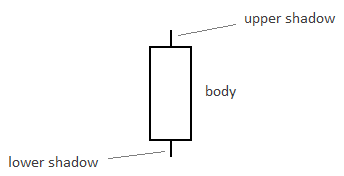
So the price depiction that is called the candlestick has a real body, and may have one or two shadows (the wick) located at the top or bottom of the real body. There are some candlesticks that do not possess a real body and are only formed by shadows (such as a doji candle). At the same time, there are some candles that do not have upper and lower shadows (marubozu candles).
Every candlestick has two parts: a body and a shadow.
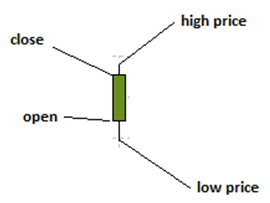
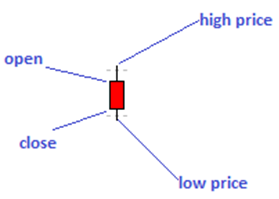
In a bullish candle (green or white colour), the closing price is higher than the opening price. In a bearish candle (red or black colour), the close is lower than the open.
The shapes and sizes of each candlestick tells a story about market activity between buyers and sellers. Here are some common shapes and sizes and what they mean. Here are some special candlesticks and what they represent.
1) Bearish Candle With No Upper Shadow
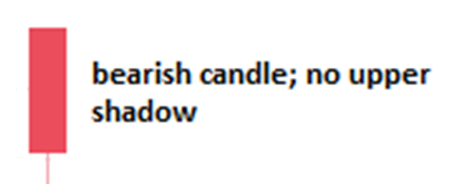
This is a long, bearish candle with no upper shadow. The price picture is that there are no buyers to drive prices above the open price. This indicates that there is strong selling pressure in the market as the open and high prices are the same.
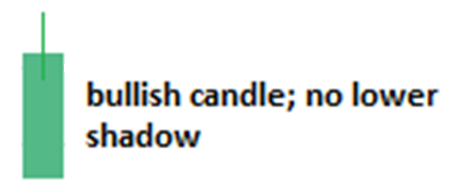
2) Bullish Candle With No Lower Shadow
3) Maximum Bid/Maximum Offer: Marubozu Candles
We also have situations where there is maximum buying and maximum selling pressure in the market, causing candles to open and close without the formation of either upper or lower shadows.
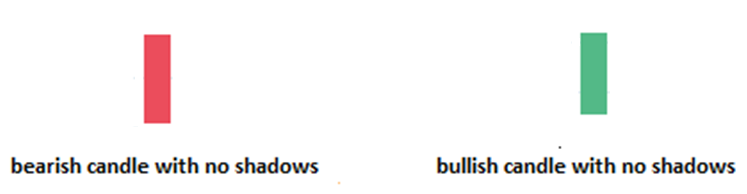
As it is, price just kicks off and terminates with no opposing action from market participants on the other side.
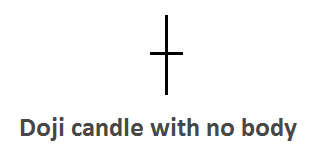
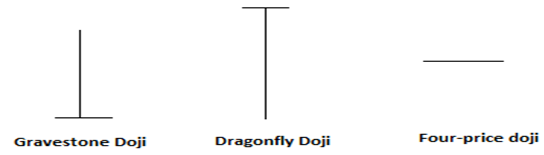
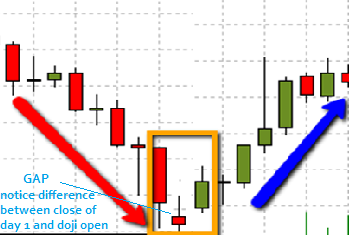
4) Doji Candle
When the candle’s closing price is the same as the opening price, a doji forms. The equal lengths of the upper and lower shadows indicate that buying and selling pressure is equal. It is a mark of indecision among sellers and buyers.
Extensive work by chartists such as Bulkowski have shown that there are more than 80 candlestick patterns. These candlestick patterns can be arranged on the basis of reliability. The candlesticks of importance are those that have a high degree of reliability. But even then, it is not important to know all of them. Some of these candlesticks have as many as 5 component candles. Unless you have been trading for decades, it is virtually impossible to remember and identify all these candlesticks when you see them on the chart. In any case, some of these do not occur frequently.
So the candlesticks of importance which are discussed below are those which are easily recognizable and tend to occur very frequently on the charts. Some of them are listed below.
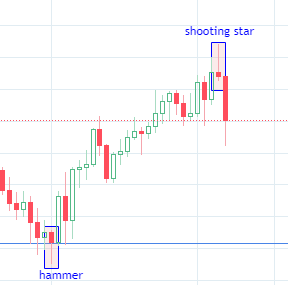
These candlestick patterns have only one candle. These candles are usually known as pinbars, because of the appearance of the longest shadows on the candles that make them look like pins. There are four common pinbar candles.
– Hammer occurs when a downtrend is ongoing and is considered a candlestick that signifies that a potential bottom is forming, hammering out a bottom.
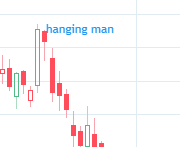
– Hanging man is a similar-looking candlestick to the hammer, but it occurs during an uptrend and signifies that a potential top is forming.
– Shooting star occurs when an uptrend has been on for some time. It features a candle with a small body, a long upper shadow and a small or absent lower shadow. This signifies that sellers have pushed prices lower after hitting a top (the tip of the long shadow).
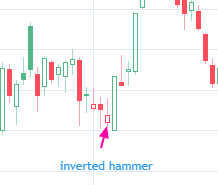
– Inverted hammer resembles a shooting star, but occurs at the bottom of the trend. It represents a failed attempt by sellers to achieve a lower low on the price, and usually requires a bullish candle to follow it to confirm the trend reversal.
In terms of reliability, these candlesticks are not enough to indicate that the trader should trade in the direction of the reversal. However, they are very important because they precede the candlesticks that actually indicate the reversal. There are some criteria which must be followed to make them more reliable.
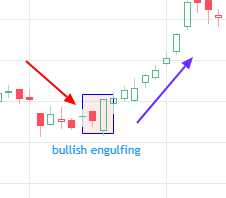
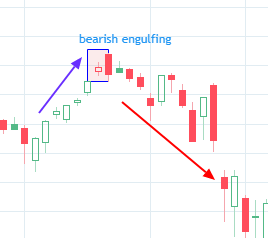
Please note that the shadows are not used in the measurement of the candles. Only the real bodies of both candles are considered when checking to see if the 2nd candle engulfs the first one.
This pattern has a bullish and bearish variant.
The candle that follows the pattern must close higher than the day 1 high, or close lower than the day 1 low, for the pattern to be deemed valid.
This pattern usually requires confirmation from a third candle known as the outside day candle. This 3rd candle must be longer and close lower than the day 1 candle (bearish) or long and close higher than the day 1 candle (bullish).
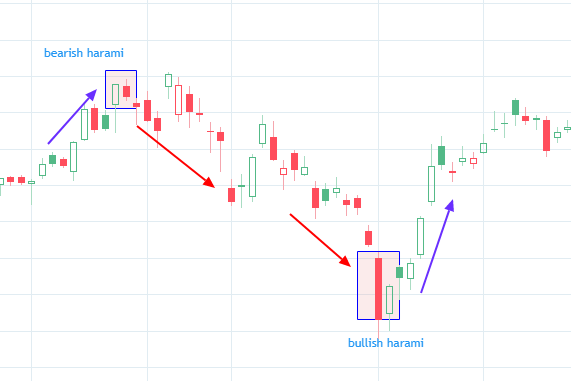
Take note of the colour of the candle that follows the harami pattern, as well as the length and closing price of this candle. It must follow the reversal direction and at least close higher (bullish) or lower (bearish) than the harami pattern.
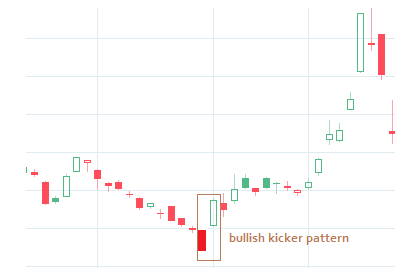
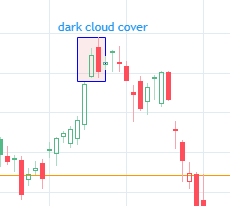
This formation is indicative of a dramatic change in investor sentiment. A gap must occur between the two lines. It works equally well in both directions. Its relevance is magnified when occurring in the overbought or oversold area. No confirmation is required.
From the 2-candle patterns, we now move to the more complex 3-candle patterns. Due to the fact that they use up more candles, the index of reliability of these patterns is higher than with the 2-candle patterns. The important ones are discussed below.
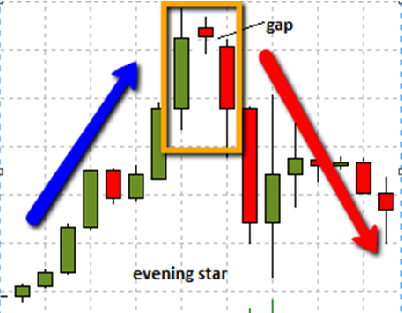
The pattern is a 3-candle pattern and is very reliable.
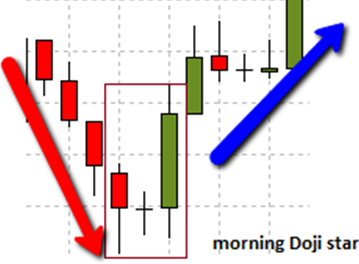
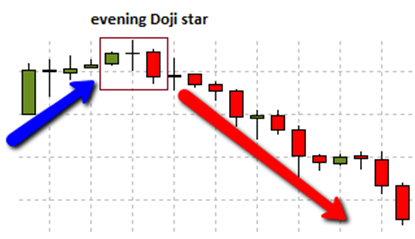
The difference between the morning/evening doji star patterns and the morning/evening star patterns discussed below, is the location and appearance of the 2nd candle.
– In the morning/evening star patterns, the 2nd candle forms a gap above or below the 1st candle. Also, the 2nd candle is not usually a doji. The 3rd candle closes the gap and continues the reversal trend.
– In the morning/evening doji star, the 2nd candle is always a doji.
This is a 3-candle pattern made up of:
Bearish reversal pattern
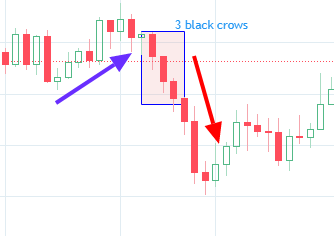
The three black crows tend to be of almost equal length, but this is not a hard rule.
Bullish reversal pattern
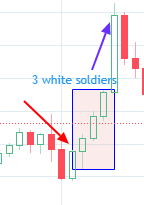
The three white soldiers tend to be of almost equal length, but this is not a hard rule.


