
Published: September 22nd, 2022
If you were into the USDJPY bullish signal, you have grabbed beyond the 400 pips of profit. The massive buying pressure in this pair came from higher US interest rates and no intervention from the Bank Of Japan. As a result, the Japanese Yen reached a multi-year low against the US Dollar, sending the USDJPY price above the 146.00 level.
The situation has changed as the USDJPY price faced a sharp 500 pips crash in a single day, which could open a reversal trading opportunity.
In the latest press briefing, Japanese Finance Minister Shunichi Suzuki showed concern regarding the excessive forex moves. He reiterated that they are closely monitoring the price and will take necessary measures with authorities of other countries.
Moreover, Japan’s top currency diplomat Masato Kanda said the forex action could be taken at any time, even if it is a holiday.
The excessive volatility after a massive 26% move since January 2022 is a strong sign of a trend reversal. Therefore, investors should closely monitor intraday swing levels to find a reversal area from where a trading opportunity comes.
Let’s see the future price of USDJPY from the USDJPY technical analysis:
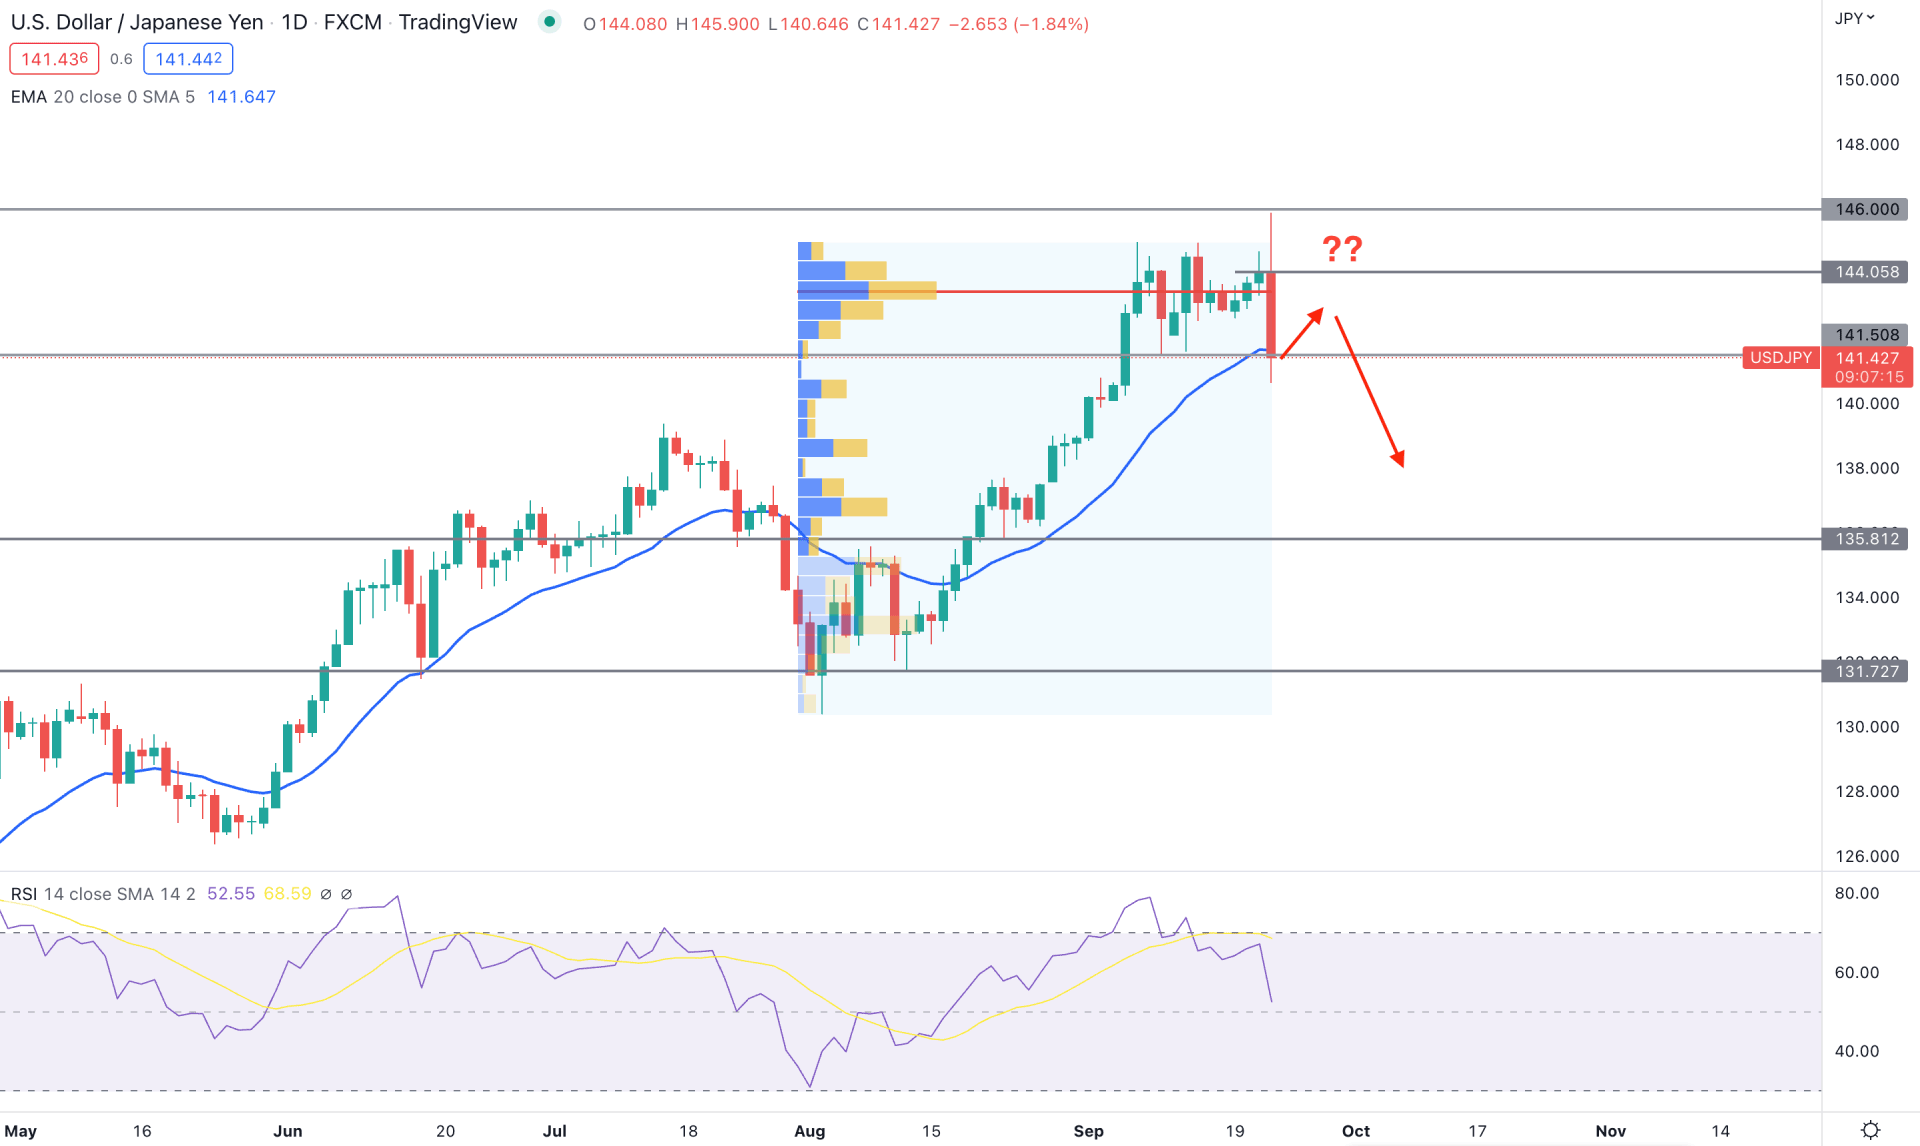
The massive 26% year-to-date gain needs sufficient momentum and pressure for a trend reversal. However, the fixed range trading volume indicator would not disappoint bears as the highest trading volume from August low to September high appeared with the post-FOMC sentiment.
The change in volume with strong exhaustion from the top opened a strong possibility of a trend reversal, where investors should closely monitor how a new swing low forms. After the FOMC, the price increased, grabbed the buy-side liquidity above the 144.95 double top area, and made a strong bearish intraday move.
The dynamic 20 DMA changed its position from support to resistance, opening a bearish possibility. The Relative Strength Index Indicator also shifted its direction to the sellers’ side from the overbought area.
Based on the daily outlook, investors should monitor how the daily candle closes, where the 141.50 level will be crucial. Although the intraday selling pressure is strong, investors should wait for a bullish correction. Any further selling pressure from 143.00 to 144.10 area could offer a decent bearish opportunity toward the 138.00 level.
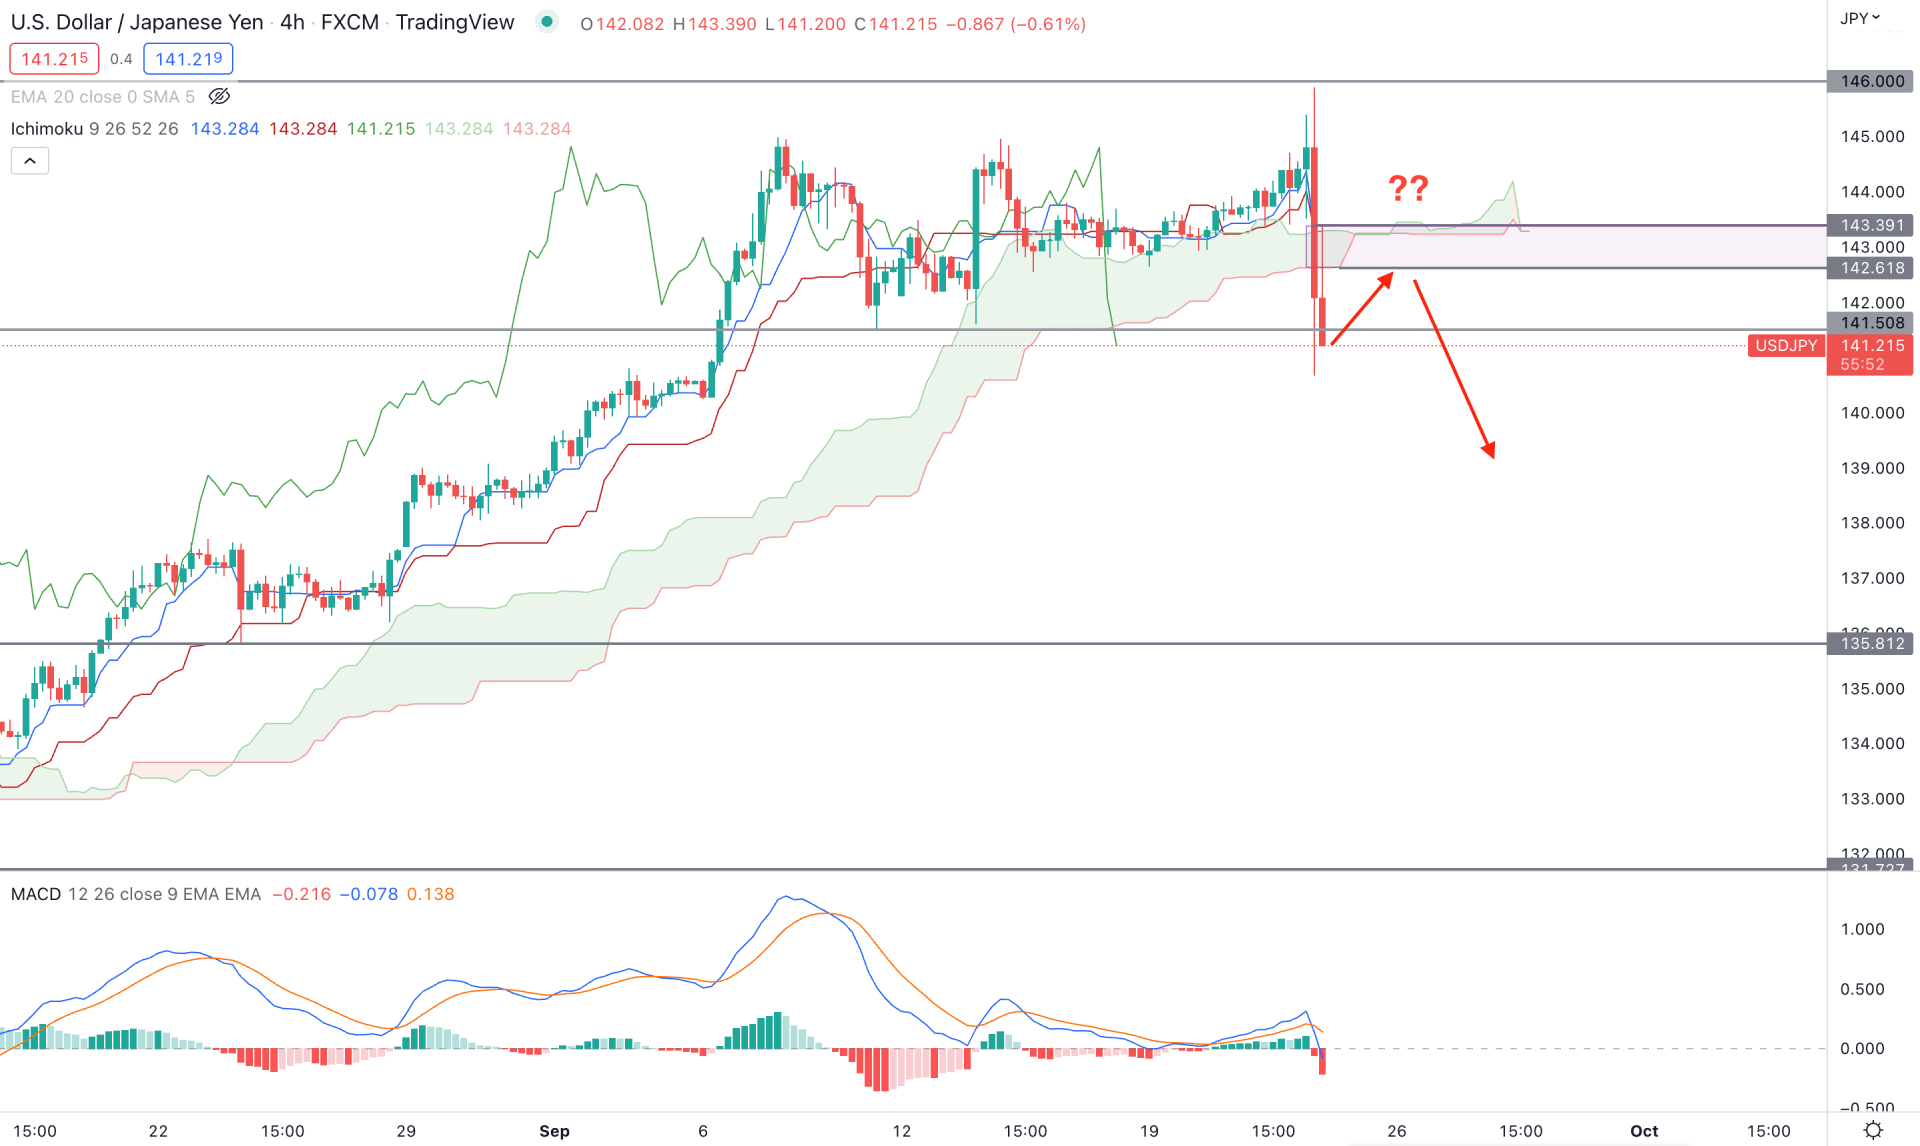
In the H4 chart, the Ichimoku Cloud indicator shows a strong sign of a trend change where the latest H4 candle appeared below the Cloud support before grabbing the buy-side liquidity. In that case, a new H4 candle below the 141.50 level could boost the selling pressure, where a suitable trading entry might come after a considerable correction.
In the future cloud, the Senkou Span A and B came closer, where a bearish crossover could increase the selling possibility. The MACD Histogram is also bearish with a bearish crossover in MACD lines, which is a sign of a strong seller’s presence in the market.
Based on the current price action, a minor bullish correction is pending in this pair, where the primary idea is to find sellers’ rejection from 142.50 to 143.40 zone to target the 135.81 support level.
On the other hand, a bullish recovery above the 143.40 level with a counter-impulsive bullish H4 candle could eliminate the current outlook and resume the existing bullish trend.
The 500 pips movement within 2-3 hours can make it hard for traders to open any position until there is sufficient correction. However, the counter impulsive pressure with a stable daily close would be a decent opportunity to join the rally, even from a minor swing.
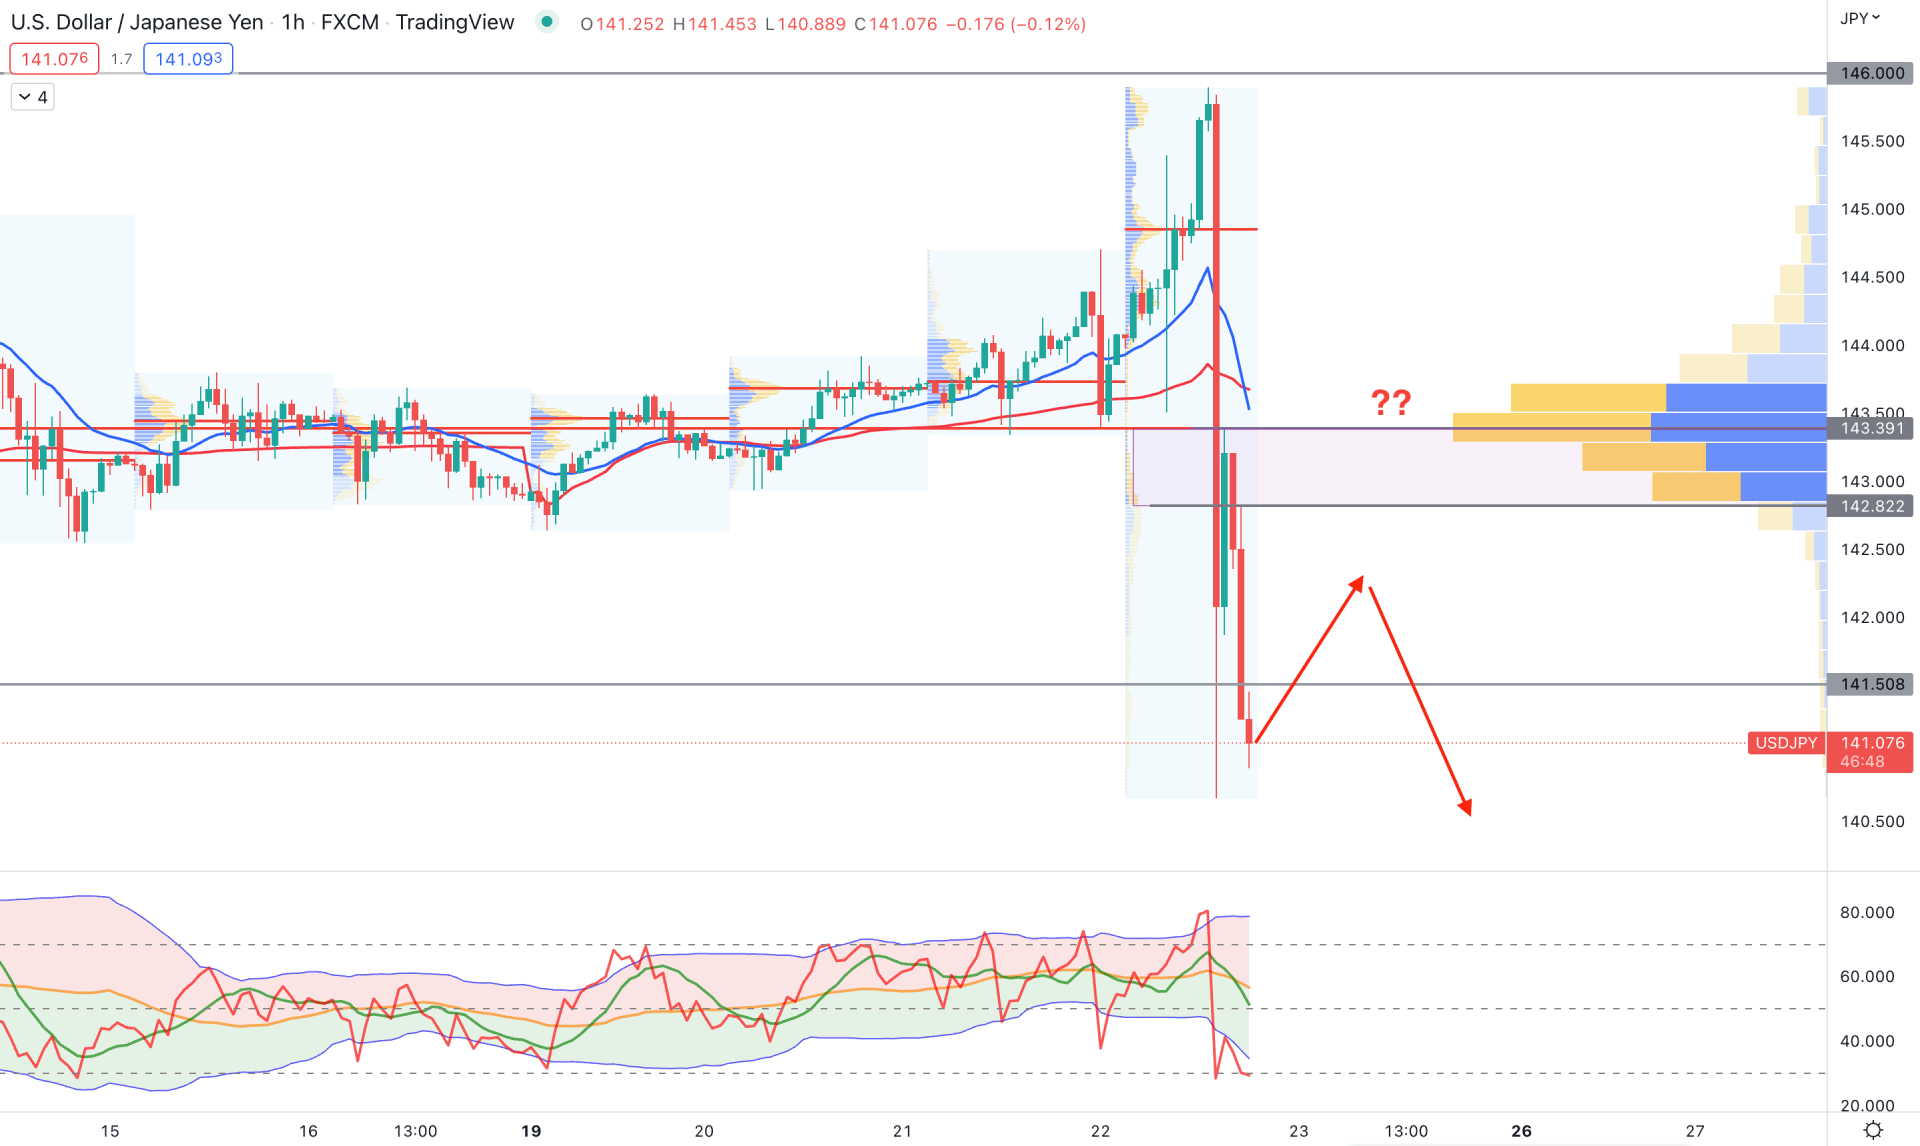
Based on the visible range volume indicator, the highest trading volume level of 143.30 supports bears as the current price is below it. The excessive selling pressure made a gap between the price and dynamic 20 EMA resistance, where a minor bullish correction is pending.
The Traders Dynamic Index also shows a bullish possibility in the market as the current TDI level reached the oversold level.
Based on the H1 structure, investors should wait for a bullish correction, where any bearish rejection from dynamic resistance or 142.82- 143.30 zone could offer a bearish opportunity towards the 138.00 area.
On the other hand, breaking above the 143.30 level with a bullish H1 candle could eliminate the current bearish structure and increase the price towards the 146.00 level.
Based on the current analysis, USDJPY is more likely to move down, despite the strong US Dollar. Investors should closely monitor how the daily candle closes where any bullish correction and bearish rejection from intraday swing points could offer a bearish opportunity.


