
Published: July 12th, 2022
In the latest Non-farm payroll report, the US job showed an improvement by coming at 372K vs. 260K expectation. Moreover, the unemployment rate was stable at the 3.6% level with no sign of easing the labor market. In that case, investors may experience another rate hike in the July meeting that may come with a 50-75 bps. According to FedWatchTool, the probability of the 75 bps rate hike is 97.7% after the Non-farm payroll release.
Moreover, the latest FOMC meeting minutes showed that the inflation picture is unsupportive for investors where a restrictive monetary policy is needed. Moreover, the downside risk from the higher inflation could push investors to lose hope in the US Dollar.
On the other hand, the Bank Of Japan was seen to remain muted on the JPY depreciation against the US Dollar. According to the BOJ, increasing wages is essential to keep inflation under control, and there is no need for any strong changes in the monetary policy. However, analysts expect the central bank to raise the inflation forecast at the next BOJ meeting in July.
The main investors focus on this week's US CPI inflation announcement, where a higher than the previous report would be a bearish factor for USDJPY. Let’s see the future price direction of this pair from the USDJPY technical analysis:
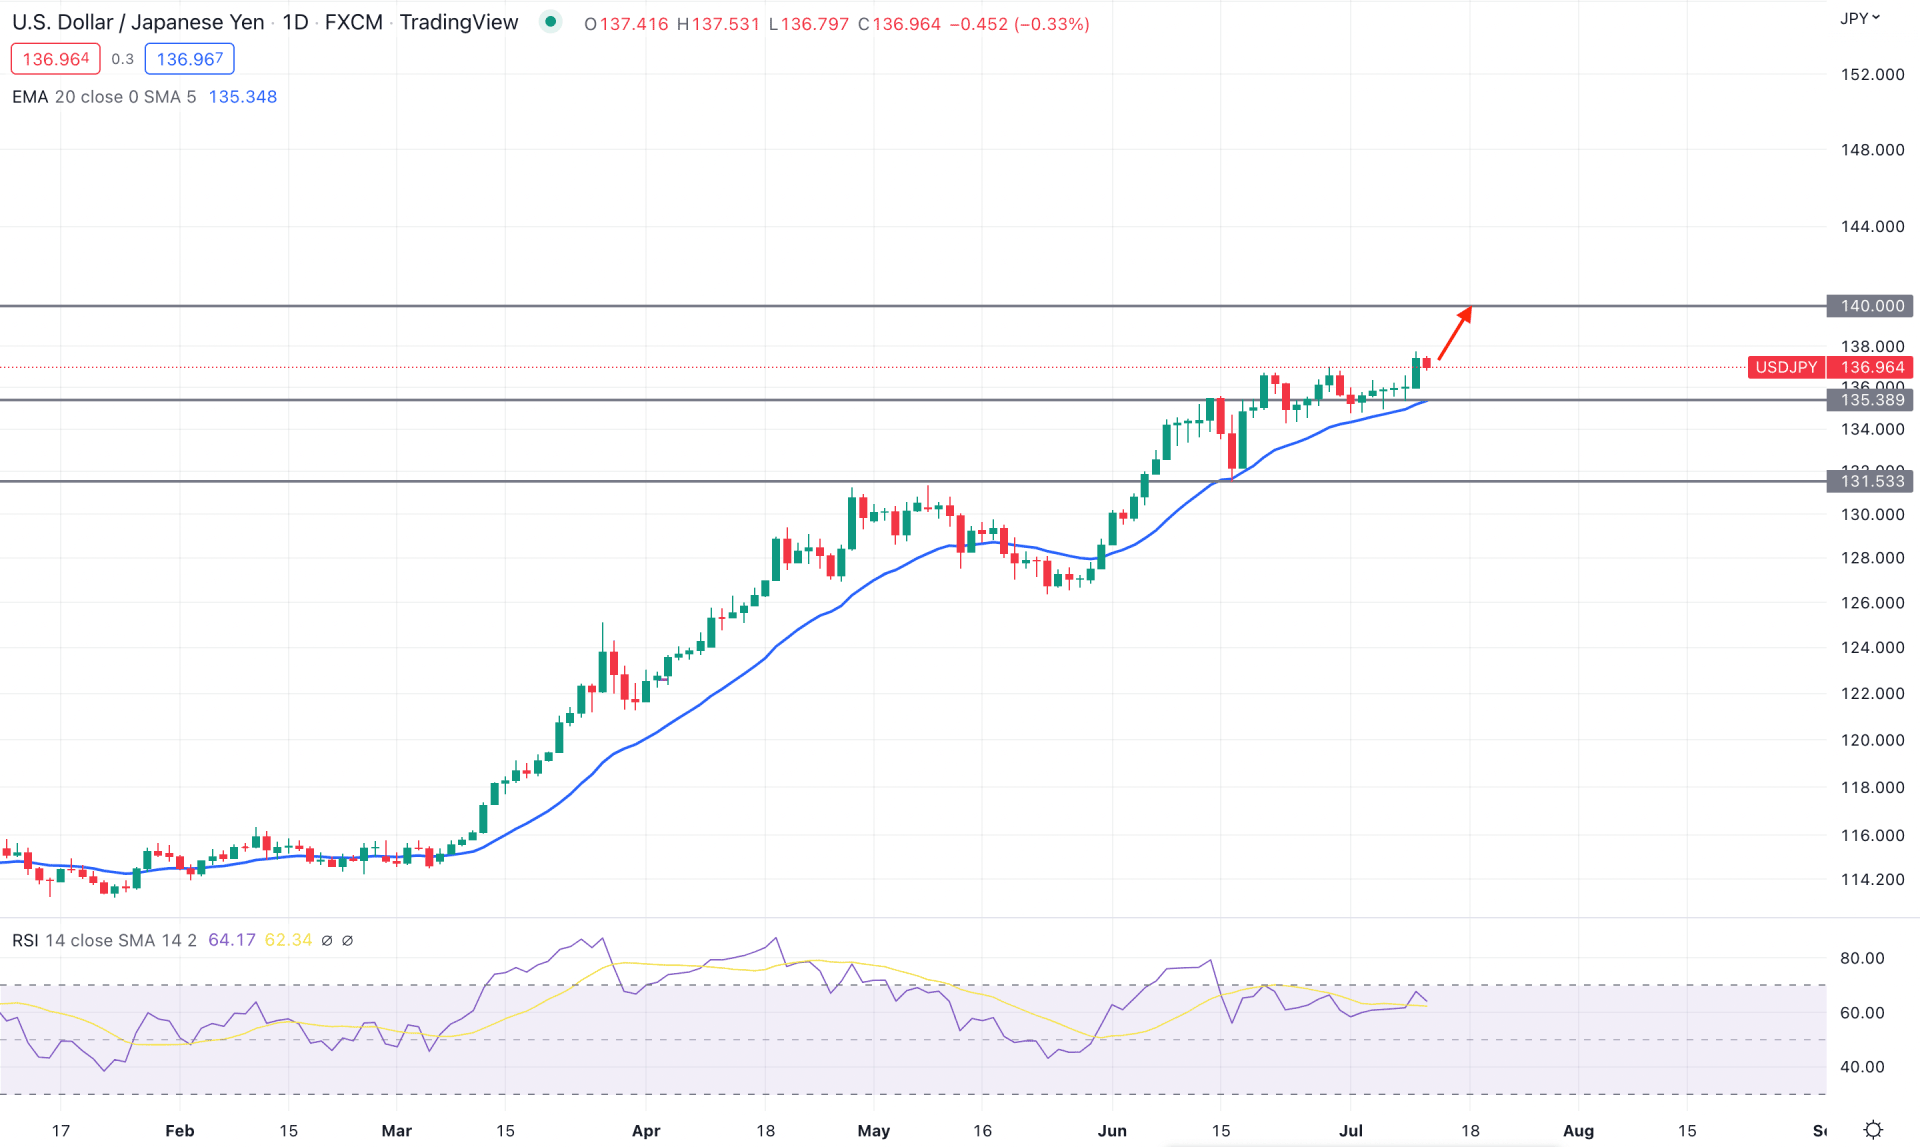
In the USDJPY daily chart, the broader market direction is bullish as it is moving up by creating higher highs from the February 2022 consolidation zone. In the recent trading days, the price remained steady above the dynamic 20-day moving average, where the bullish price action above the 131.53 support level increased the buying potentiality.
The above image shows how the bullish pressure is increasing in the USDJPY daily chart, where the daily Relative Strength Index (RSI) shows buy signals. The RSI remained steady above the 50.00 neutral level while the stable momentum at the 70 overbought area increases the bullish possibility.
Based on the daily structure, the future market direction for USDJPY would remain bullish as long as it trades above the 135.38 immediate daily support level. The primary aim of the bullish pressure is to test the 140.00 key psychological resistance from where a bearish correction may appear.
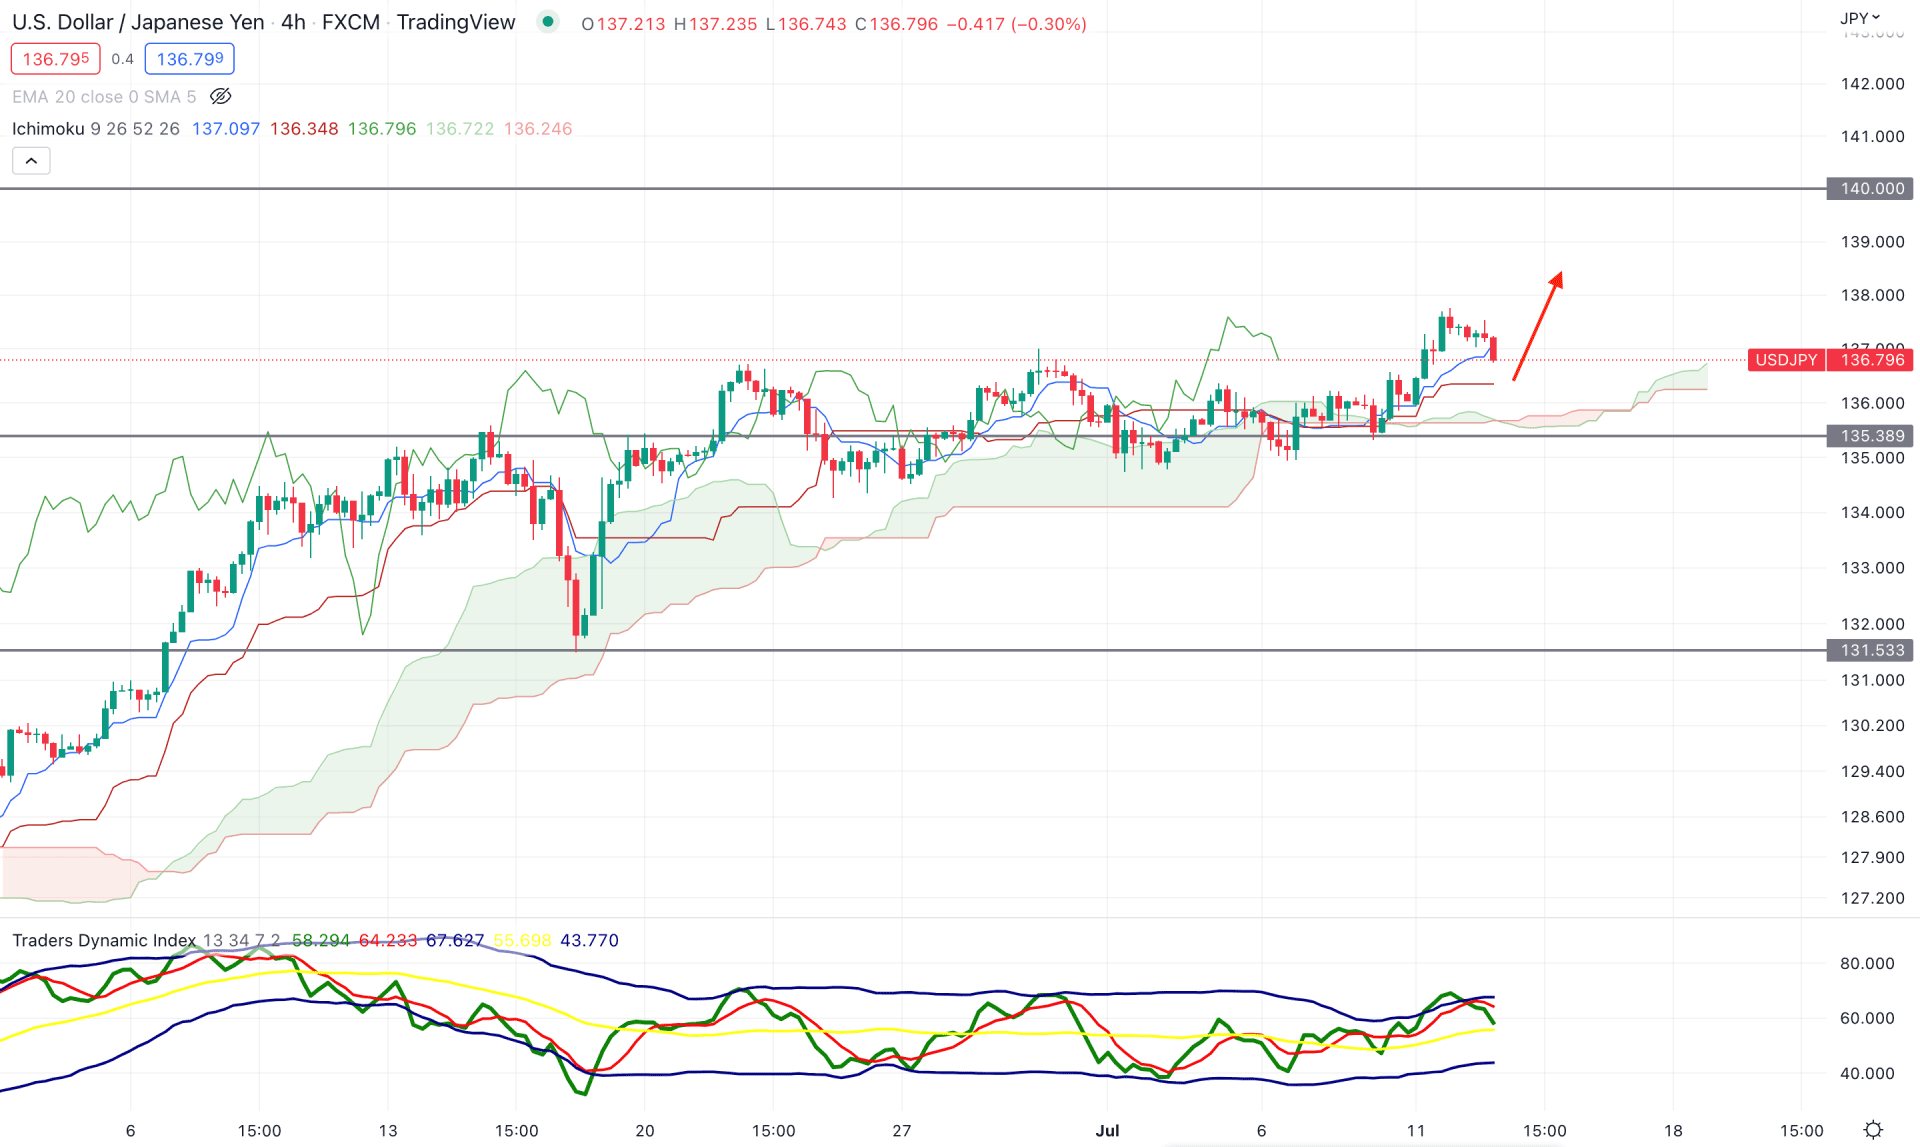
According to the Ichimoku trend trading method, the USDJPY has shown strong buying pressure in recent trading days, where the current price has been above the Kumo Cloud for a considerable time. Moreover, the future cloud shows buyers' interest by taking the Senkou Span A above the Senkou Span B with upward momentum.
The indicator window shows buyers' and sellers' dominance in the market where the Green TDI line above the 50 level indicates a strong buying pressure. Based on this structure, the TDI line already reached the upper band level and moved down. However, bulls may regain momentum as long as the TDI line is above the neutral 50 level. On the other hand, the dynamic Tenkan Sen is below the price, working as minor support, while the Kijun Sen is flat.
Based on the current price action, the price could reach the Kijun Sen support following the current intraday selling pressure. However, any bullish rejection from 135.40 to135.50 with a bullish H4 candle above the Tenkan Sen would be a bullish signal. In that case, the price may move higher towards the 140.00 level.
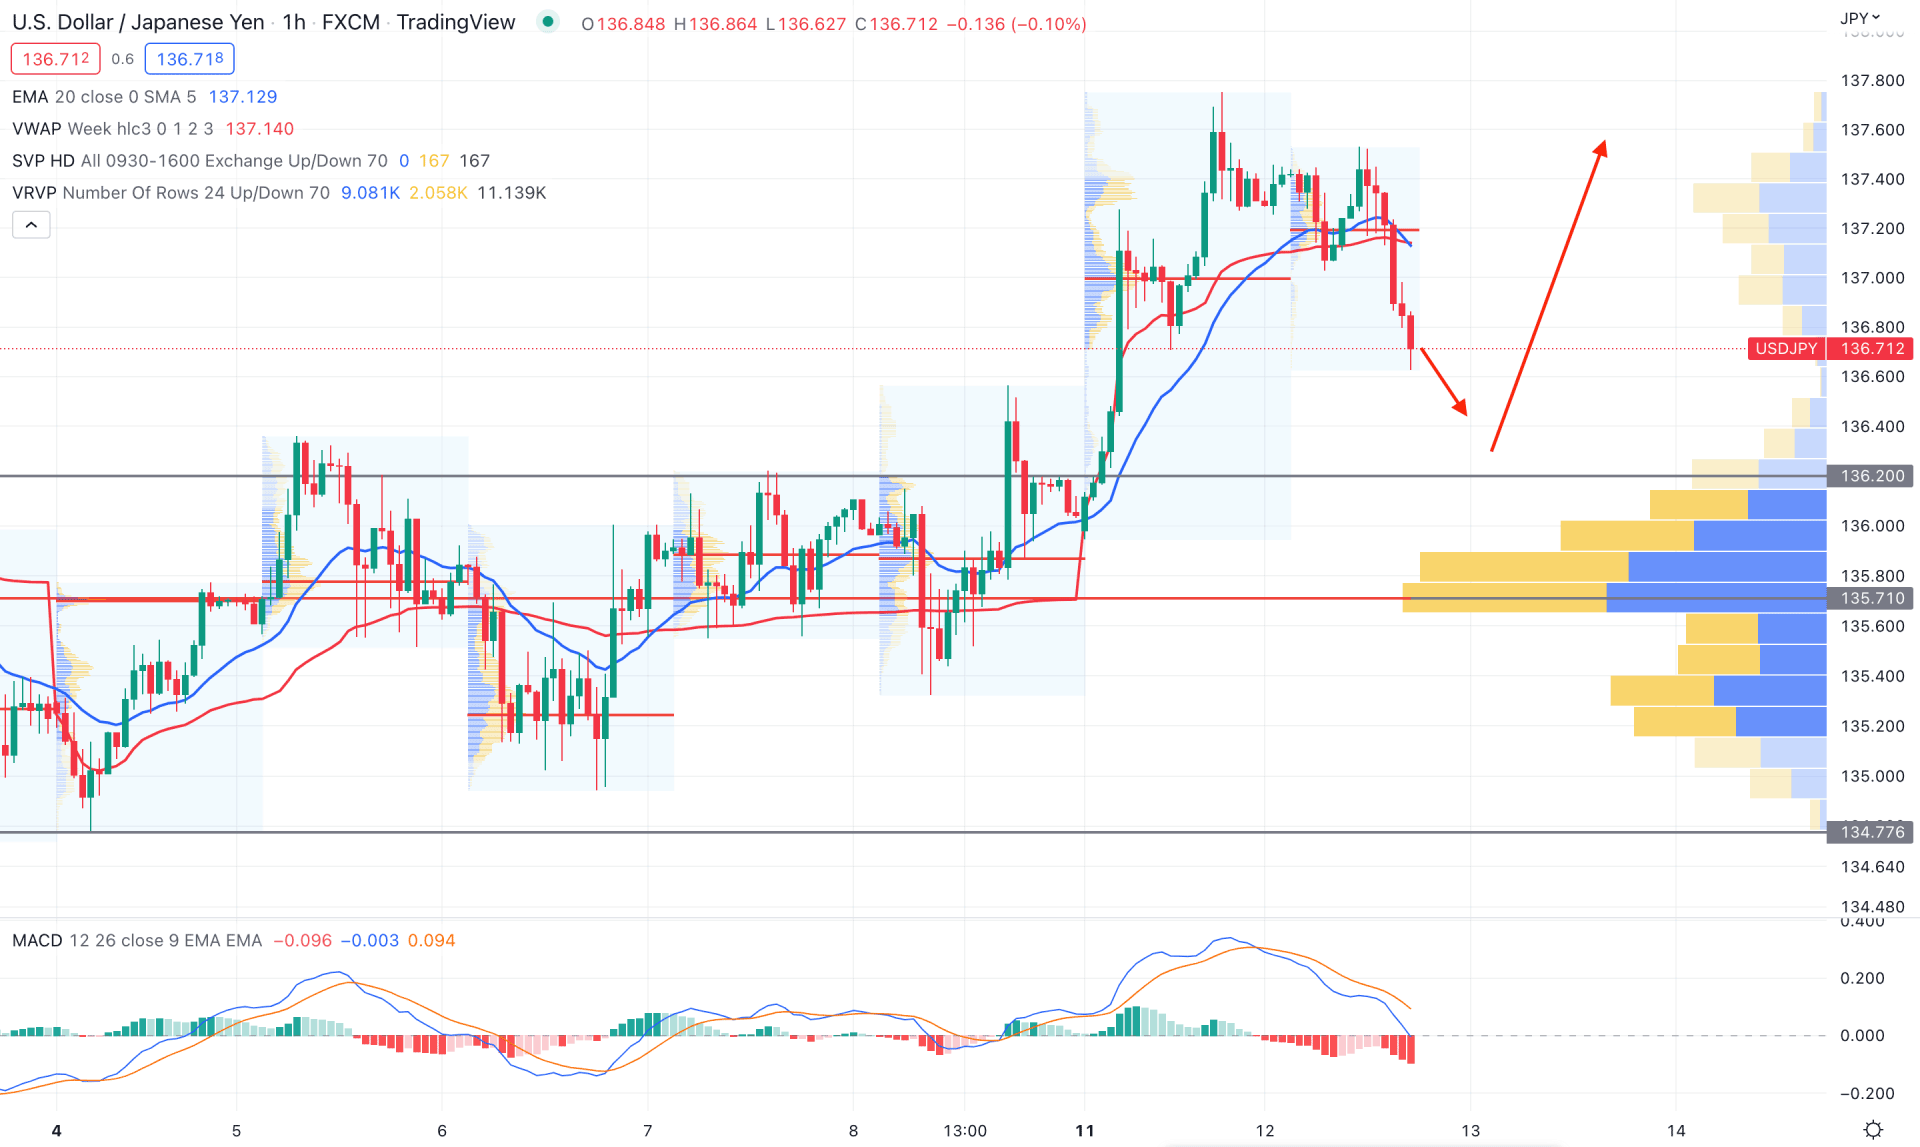
In the H1 timeframe, the USDJPY price remained strongly bullish, although a minor selling pressure is visible below the 20 EMA and weekly VWAP. Based on the volume structure, the strong trading volume is found at the 136.71 level based on the visible range trading volume indicator. As the strongest trading volume is below the current price, any rebound from the 136.50 to 135.60 zone could resume the current bullish trend.
The current bearish sentiment is cheered up from the MACD Histogram, which is moving down below the neutral level. Moreover, the dynamic 20 EMA and weekly VWAP are above the current price, where a bullish H1 candle above these levels is needed before going long in this pair.
Based on the H1 price action, the current selling pressure needs to be eliminated by bullish exhaustion. However, the conservative trading approach is to wait for a bullish H1 candle above the dynamic weekly VWAP to open a buy position towards the target of the 138.00 level.
Based on the current multi-timeframe analysis, the USDJPY bullish trend is still solid, and it may extend higher in the coming days. Therefore, any bullish opportunity from the intraday price action could lead to a higher success rate.


