Published: April 16th, 2020
In the previous analysis, we have mentioned several times the potential domination of the Swiss Franc over many other fiat currencies. In this analysis, will continue the same way, while analyzing the CHF/JPY currency pair.

First off, let’s observe CHF/JPY on a weekly chart. There is an extremely wide range-trading going on for the past 3 years. Price has been ranging between 107.70 support and 118.00 resistance areas. While it seems there is no major direction, CHF/JPY might look quite attractive for buyers in the medium term. This is because of another range trading zone between 110.90 support and 114.38 resistance areas. Currently, price is at the bottom of the range, and broke above the 200 Simple Moving Average, suggesting bullish domination.
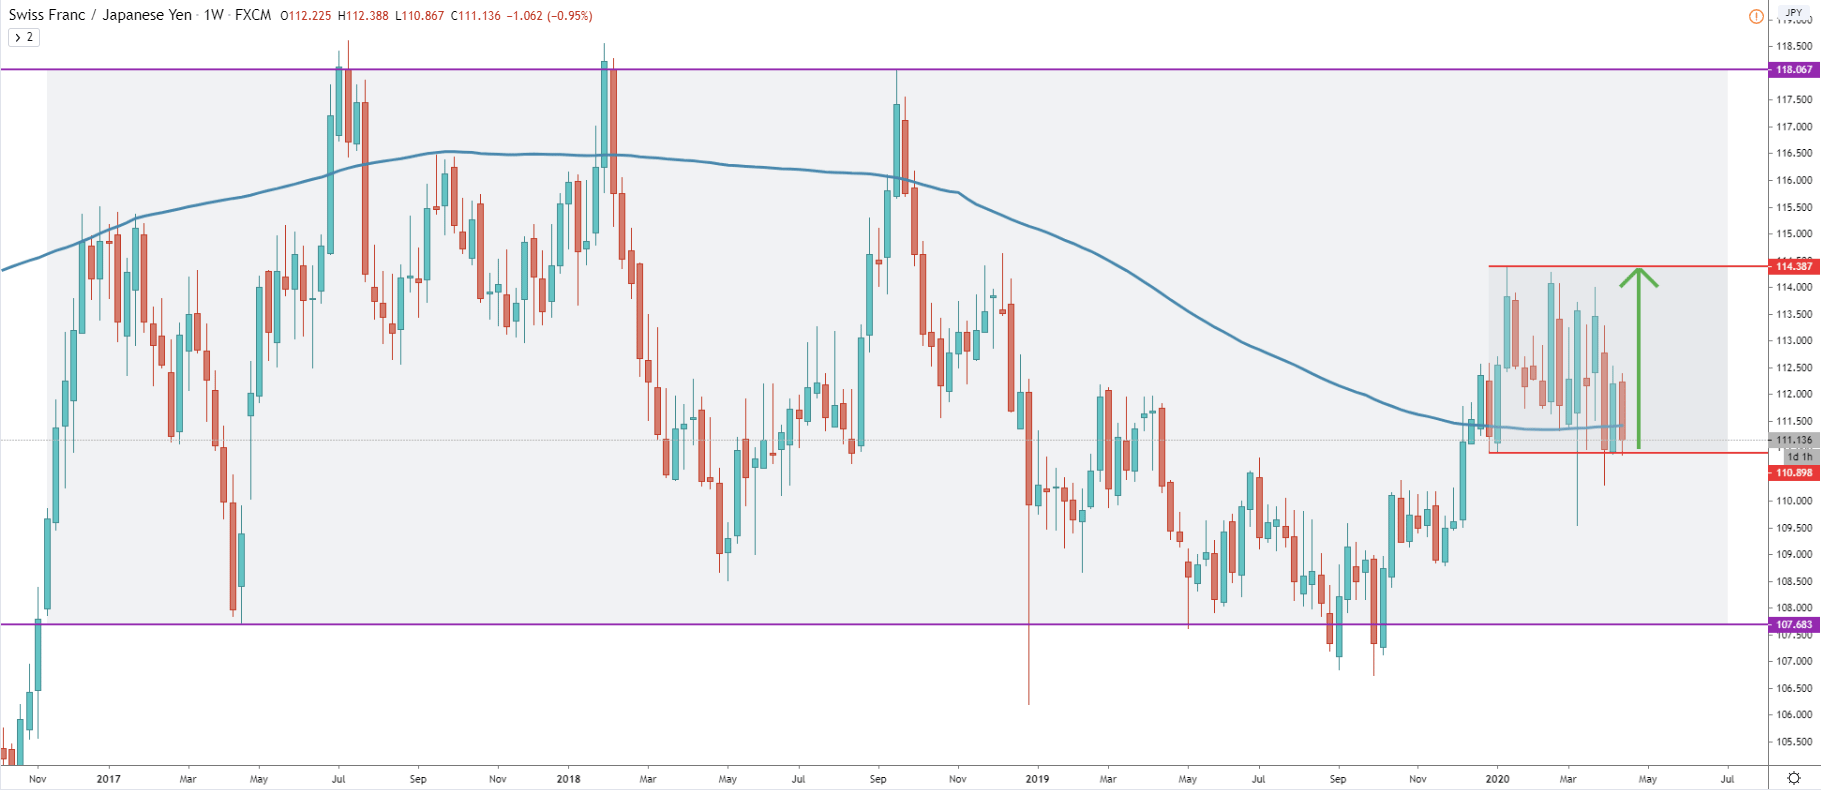
Another Weekly chart shows quite a similar picture in terms of the price action near 200 EMA. Price broke above it and during the past 8 weeks, the EMA has been acting as the support. There was one strong attempt to break below, although price only produced the spike below but failed to close lower. Now, in order to confirm the EMA breakout, there must be a weekly close below the spike, which is at 109.54, otherwise, the long term trend is bullish.
The Fibonacci retracement indicator, applied to the May 2016 - Jul 2017 uptrend, shows the nearest support and resistance levels. The 50% retracement level is acting currently as the support and the 23.6% retracement is acting as the potential resistance. We can also see previously, price already bounced off 114.62 resistance, and this could be the strong resistance once again.
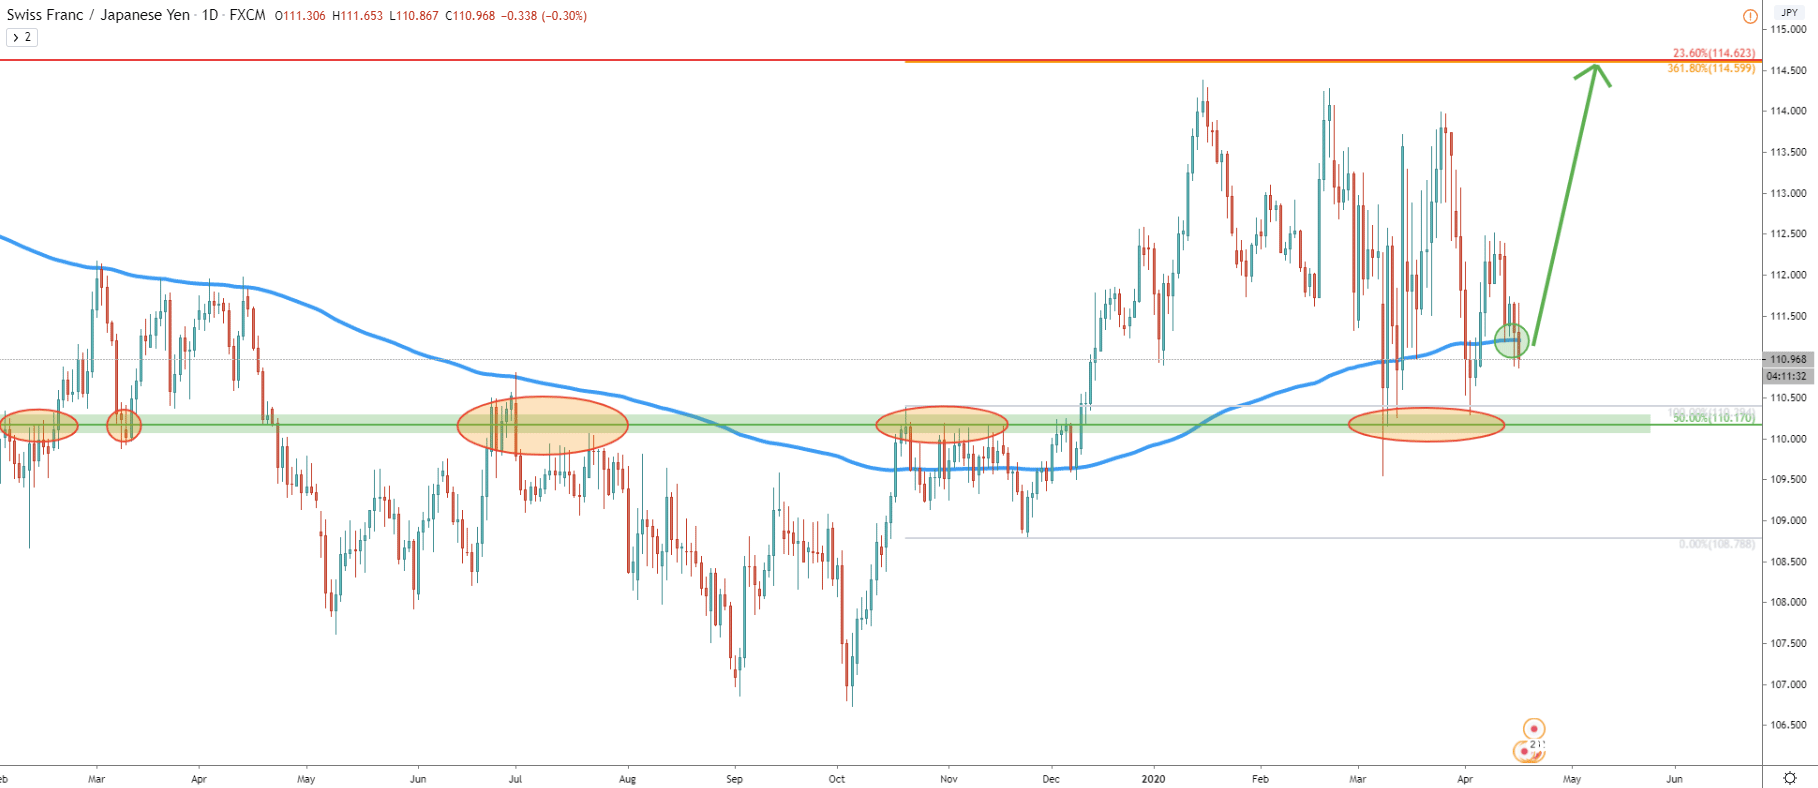
Moving on to the Daily chart, the 50% Fibs support at 110.17 plays a very important role. We can clearly see how many times the price has been bouncing off this level. It had been acting as the support as well as resistance for at least 4 times in a row. Perhaps this time will not be an exception, and if so, CHFJPY is expected to test the 114.60 level in the coming days or weeks. This resistance level is confirmed by two Fibonacci retracement levels. The first is 23.6% as per the weekly chart. The second is 361.8% Fibs, applied to the corrective wave down after the 200 EMA breakout.
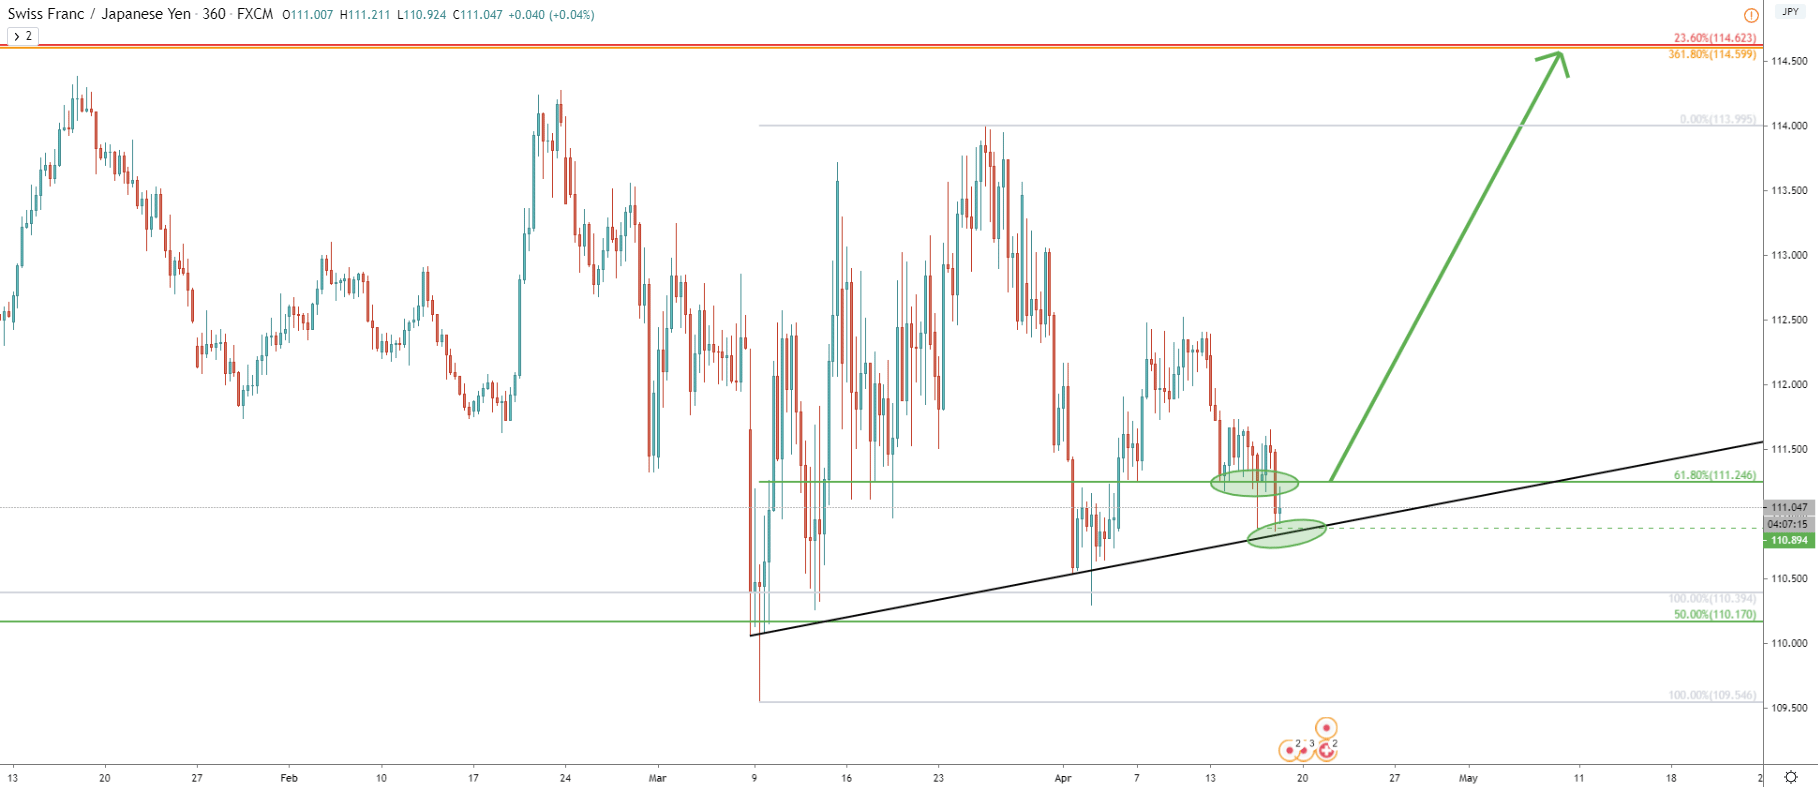
On the 6H chart, we can see that CHF/JPY is trading very close to the uptrend trendline, and it is yet to be seen whether it will be rejected or broken. But at the same time, 61.8% Fibs at 111.54 have been rejected. Price produced the spike below but failed to close lower. Therefore, in order to confirm the Fib support breakout, the 6H candle must close below the 110.89.
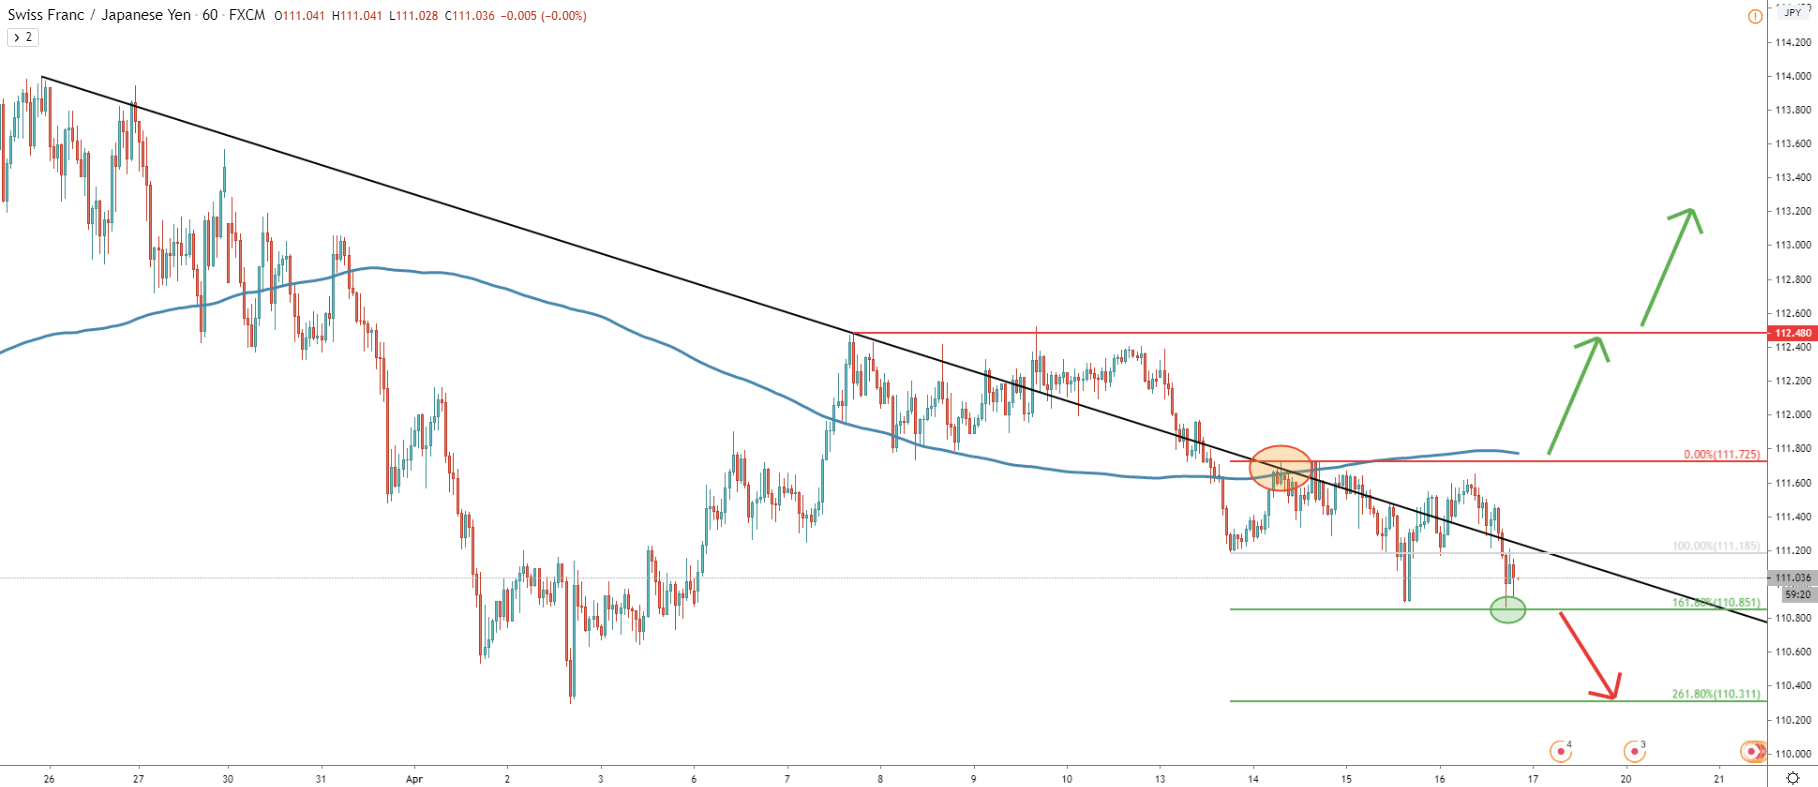
On the 1H chart, there is another support level to watch. We have applied the Fibonacci retracement indicator to the corrective wave up, after the breakout of the 200 SMA. It shows that a 161.8% retracement level at 110.85 has been rejected cleanly, which is another reason to expect a potential move to the upside.
The CHF/JPY pair has entered a long term consolidation phase and currently is trading at the bottom of the range. This means, that as long as the support is being respected, CHF/JPY has a 300 pips upside potential in the medium term.
As we already discussed, there is only one strong resistance for CHF/JPY. This is the 114.60 level which is confirmed by two Fibonacci retracement levels as per the 6H chart.
At this stage, while support levels are being rejected, the probability of the downtrend remains low. However, like anything in trading we can’t ignore the bearish scenario. The first sign of downtrend would be a 1H candle break and close below the 110.86 support as per the 1H chart. But if we consider a long term price action, only Weekly close below the 109.54 would completely invalidate a bullish outlook and could initiate a strong downtrend.
Support: 110.85, 110.31, 109.54
Resistance: 111.72, 112.48, 114.60