
Published: April 15th, 2020
There are many currency pairs which show the CHF domination in the long term. In today’s’ analysis we will observe the most popular CHF pair, the USD/CHF, and will try to understand which scenarios of the price development are the most probable.
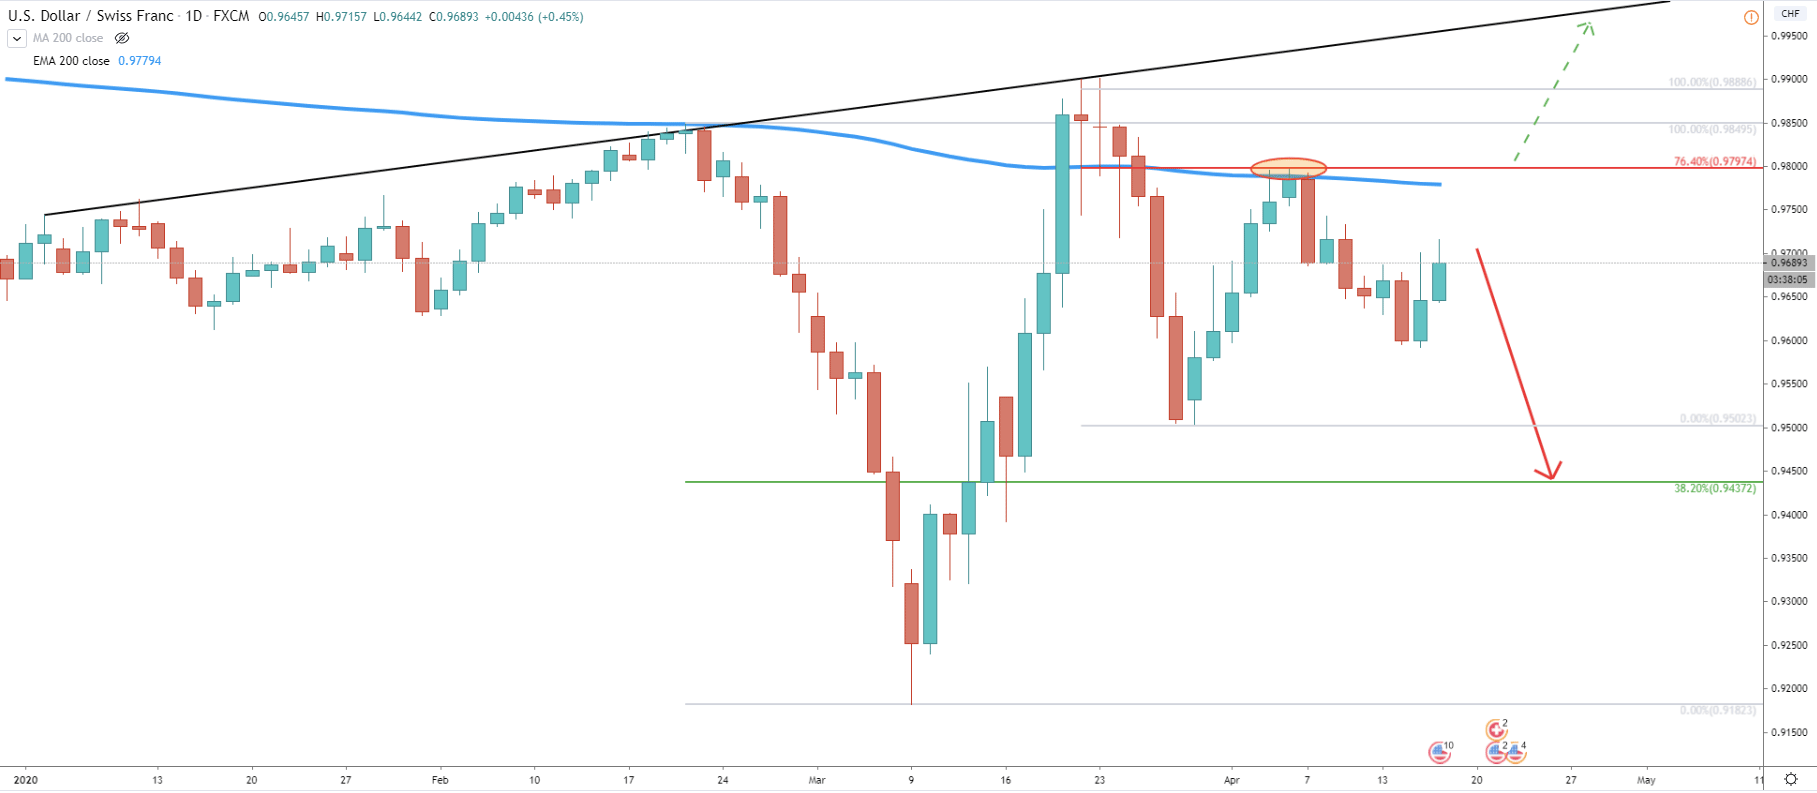
Starting with a daily chart, the price has reached and cleanly rejected the resistance trendline, where USD/CHF topped back on March 23, 2020, where price tested out at 0.9901 high. Since then the price has dropped significantly, resulting in a 4% loss, which is quite a strong move for any currency pair. However, on March 30, USD/CHF started to correct up, where price reached 76.4% Fibonacci resistance level at 0.9797. The resistance has been rejected along with the 200 Exponential Moving Average, suggesting further price weakness over the long term. And yes, after the bounce, USD/CHF started to move down one again.
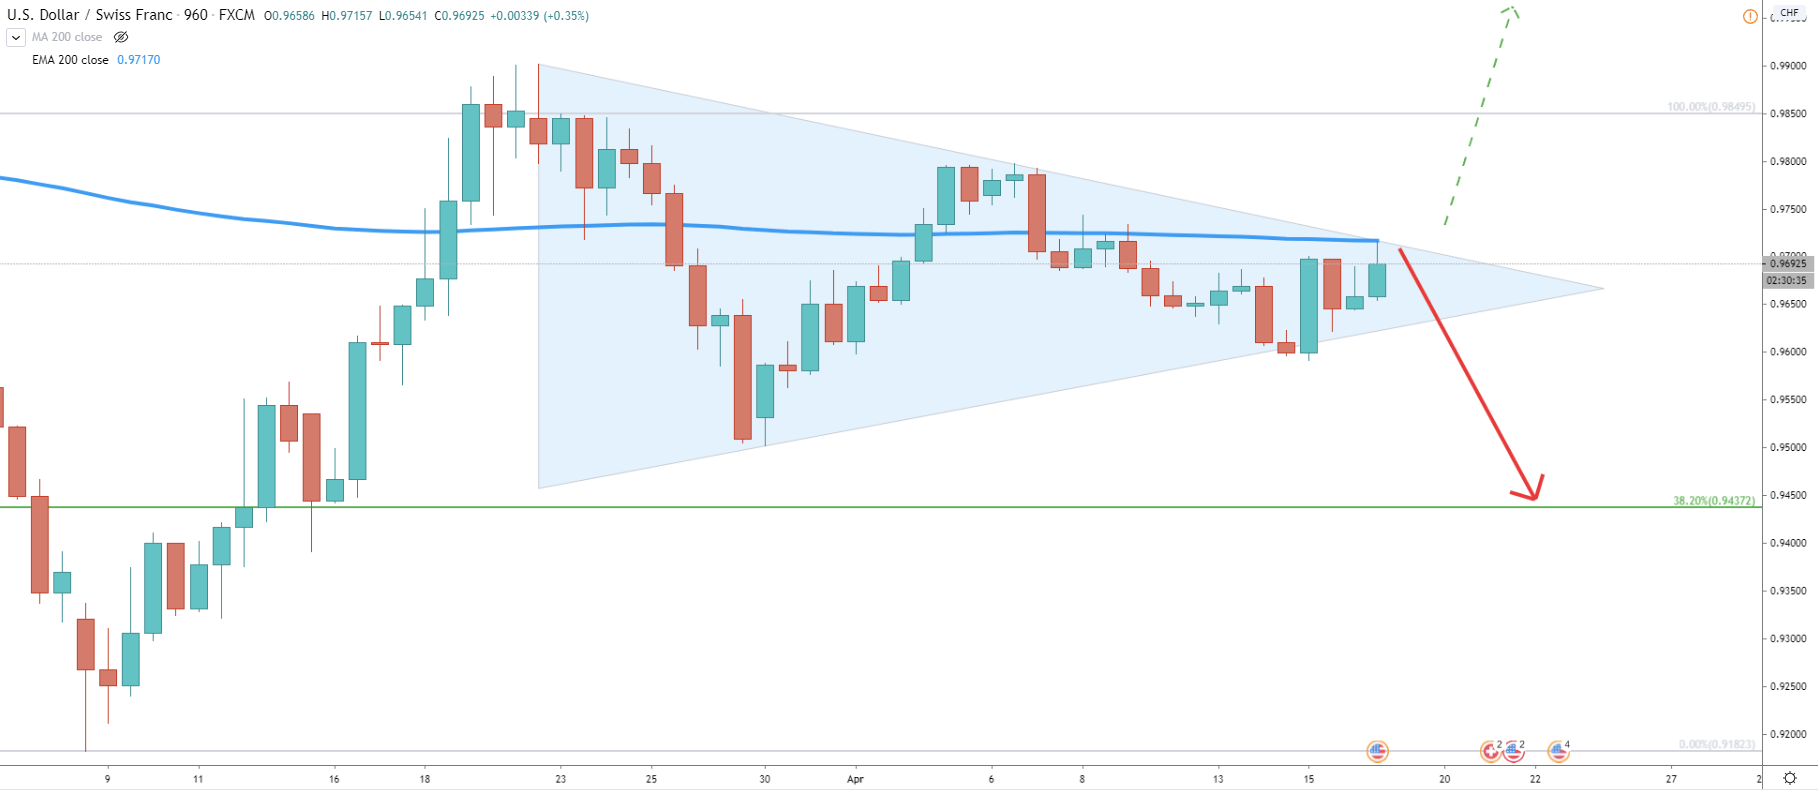
Moving on to the 16H chart, we can see the formation of the triangle pattern. The attention should be focused on the current price location. USD/CHF is trading right at the top of the triangle, and today it has tested the 200 EMA. So far there was a clean bounce off the EMA and this is very good news for the Swiss Franc as long as resistance holds. If the 16H candle will fail to break and close above 0.9715 high, USD/CHF should start moving down. From this point onwards the price decline could be very strong, although there is one very important support to watch.
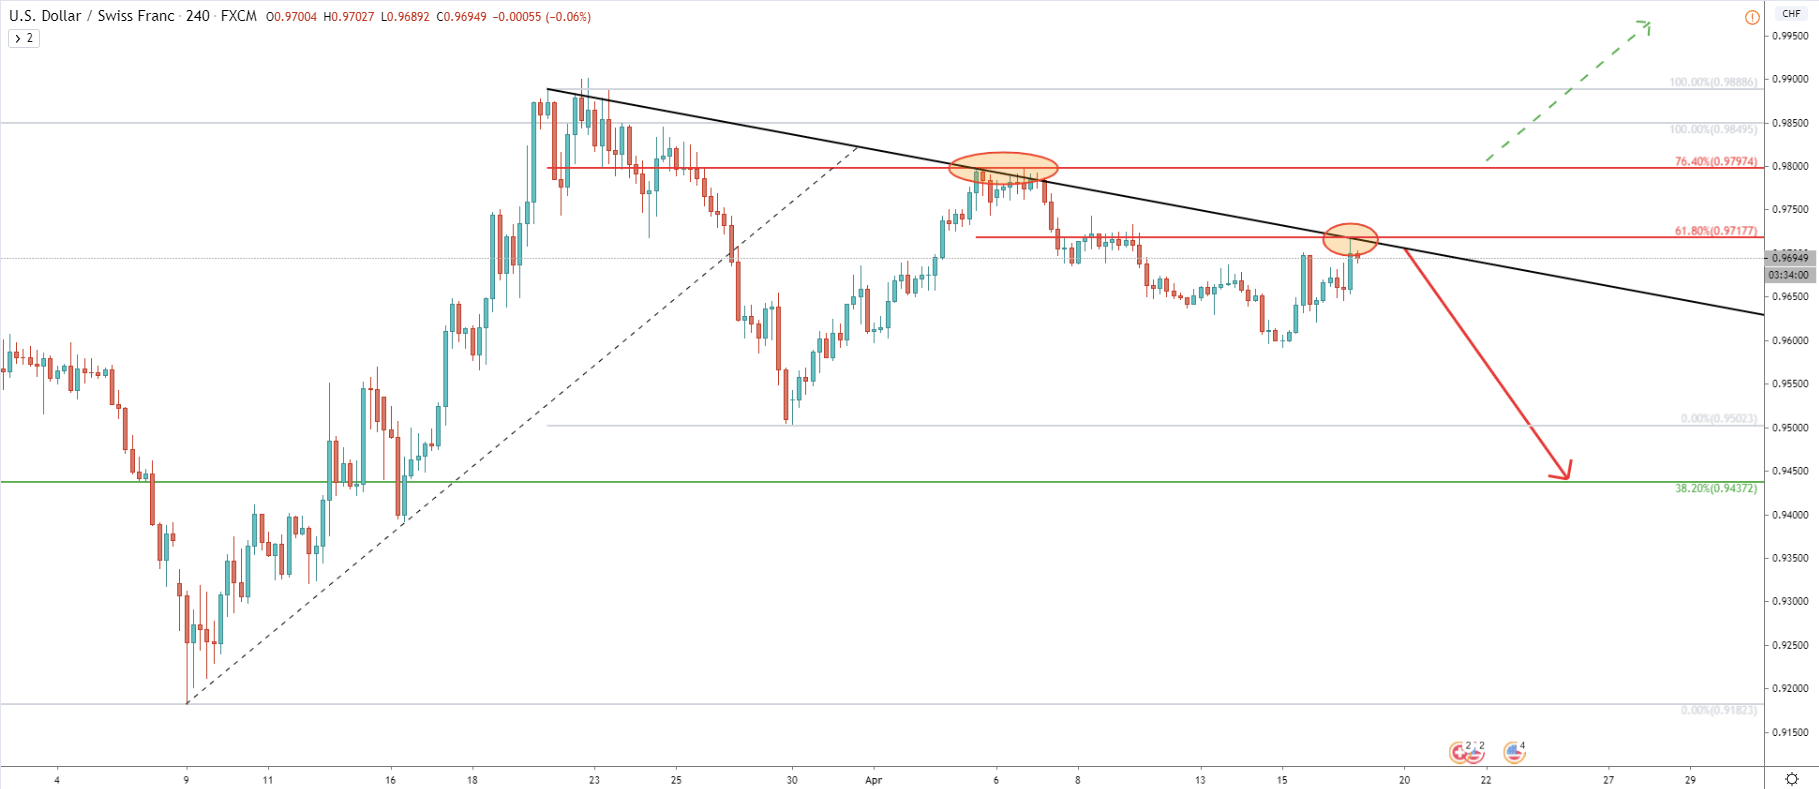
When it comes to the support and resistance levels, the 4H chart comes into play. Firstly, it shows the rejection of the 76.4% Fibs at 0.9797. Secondly, it shows the clear rejection of the downtrend trendline as well as 61.8% Fibs applied to the recent wave down (06-15 Apr). The closest downside target is seen at the 38.2% Fibonacci retracement level as per the daily chart. If/when this support at 0.9437 will be tested, it is extremely important to see the price action around it. Because if there will be a clean break and close below this level on the daily chart, the downtrend will likely continue and even accelerate.
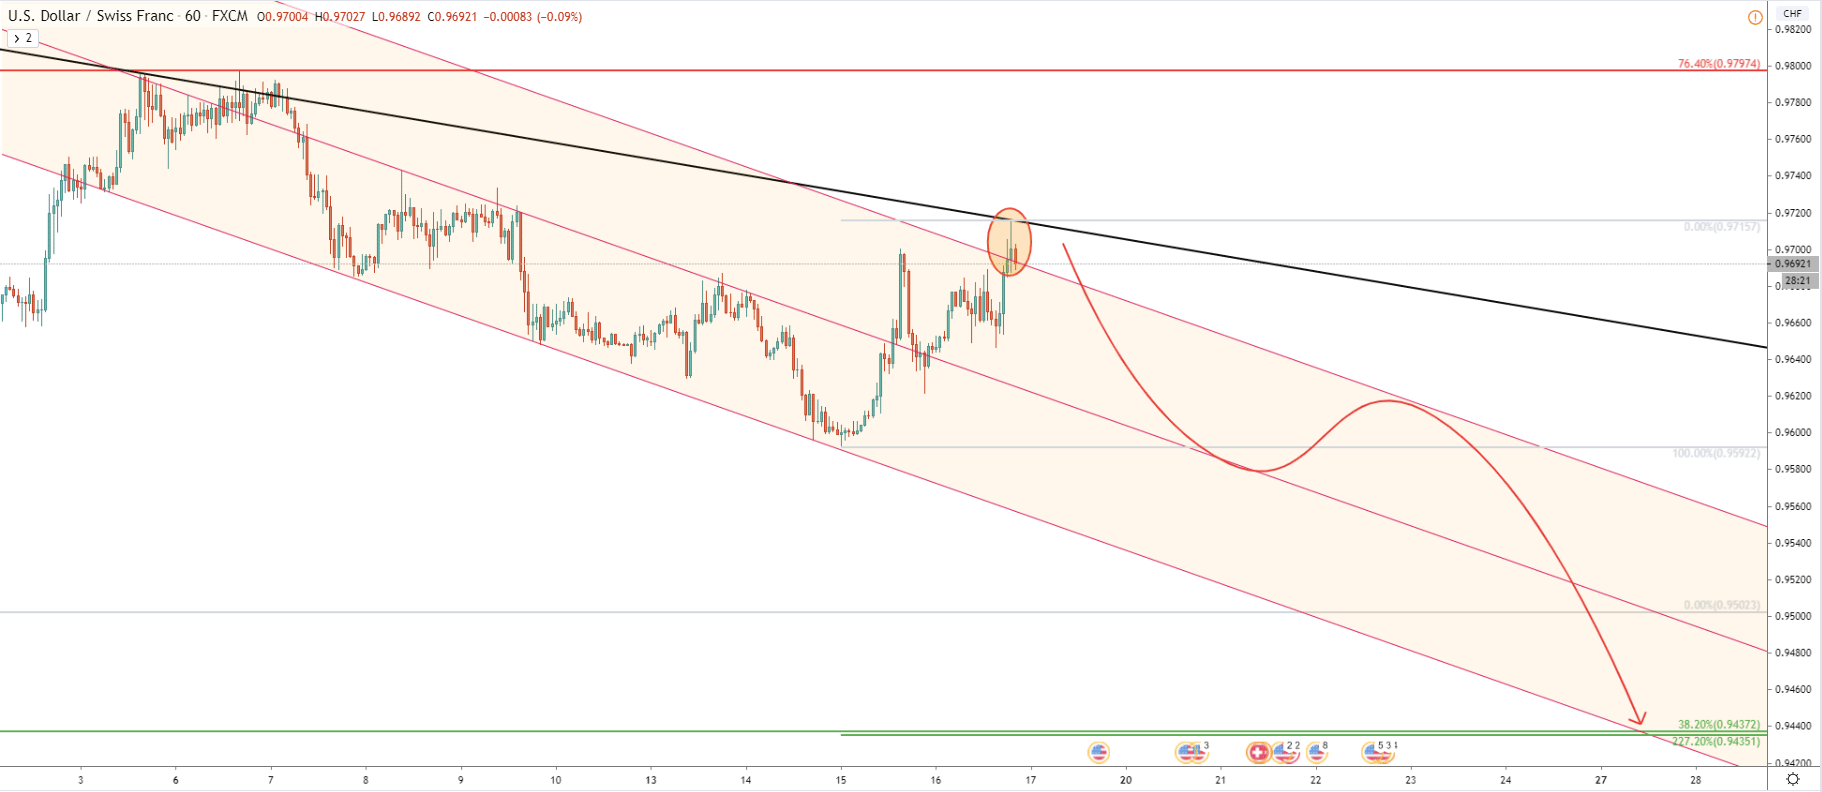
In regards to the 1H chart, we can see that price has been moving within the descending channel throughout 3-15 April. Then USD/CHF broke above and tested the upper trendline of the extended descending channel while hitting the 0.9715. Curently it might be a very attractive price area for the long term sellers as multiple resistance levels were rejected on multiple timeframes. At the same time, the long term trend remains bearish and current upside correction could be a great entry point for those who are choosing to short USD/CHF.
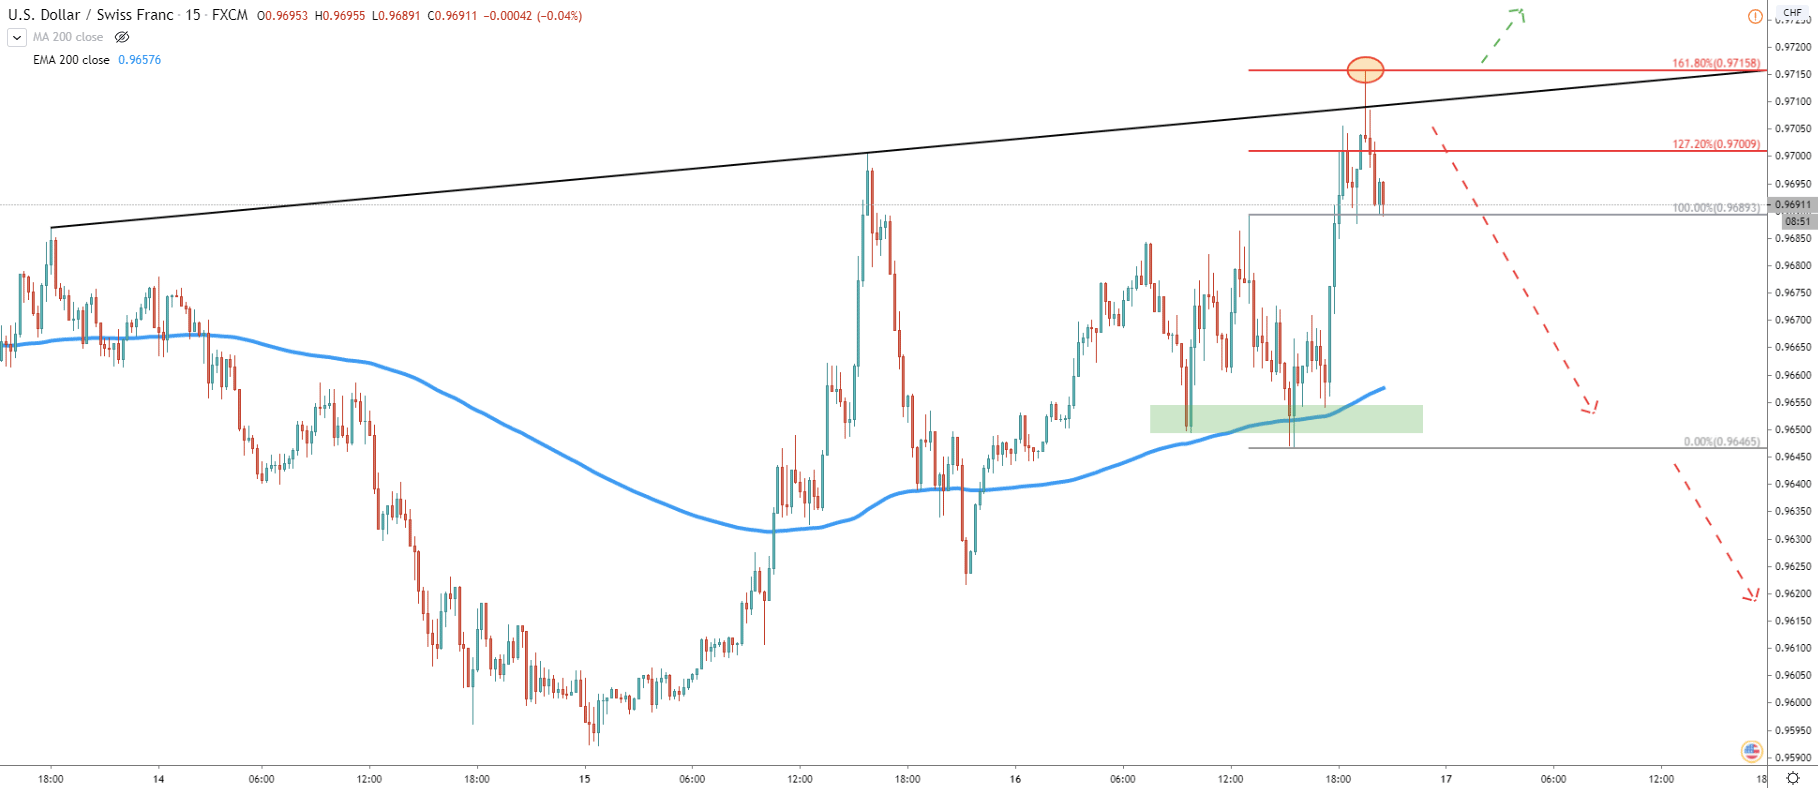
Looking at the lowest timeframe in our analysis, the 15M chart shows that price also has reached the trendline resistance, which has been rejected so far. At the same time, Fibonacci applied to the corrective wave down, where USD/CHF bounced off the 200 EMA, shows that 161.8% retracement level has acted as the resistance. Price very cleanly touched 0.9716 and rejected it. It could mean that the upside correction on the long as well as short timeframe came to an end. Perhaps now USD/CHF is at a very important decision-making point in terms of the long term direction. If it manages to hold current resistance, the strong price decline will become imminent.
On all timeframes used for analysis in this forecast, USD/CHF has reached and bounce various resistance levels. With the given price action, it seems that the price is about to start a strong move down.
As per the Daily chart, Fibonacci applied to the 20 Feb 2019 - 09 Mar 2020 trend down, shows that key resistance is based at 76.4% Fibs and the potential downside target is at 38.2% Fibs, that is 0.9437. Therefore, the nearest support level is around 250 away from the current price.
Today, there was a very clear rejection of the 161.8% Fibs at 0.9716, as per the 15M chart. If the price will break above this level, there can be further growth towards the key resistance at 0.9797. Only daily break and close above it, will completely invalidate bearish outlook, and US Dollar might start prevailing over the Swiss Franc in the long run.
Support: 0.9437, 0.9592
Resistance: 0.9616, 0.9797