
Published: June 26th, 2020
Based on our previous analysis, it was obvious that the sentiment is mixed and is not very clear which direction AUD/NZD will choose. We have mentioned that there is a high probability of both outcomes, the downtrend as well as the uptrend. Currently, the probability is slightly in favor of the uptrend, at least in the short term. But in the long run, the downtrend might continue.
The chart taken from our previous analysis shows a clear rejection of the 161.8% Fibonacci retracement level at 1.0581, after which the price went up and broke above the 200 Simple Moving Average. These are some strong factors that favor yet another move to the upside. It could be either a short term move or a continuation of a long term uptrend.
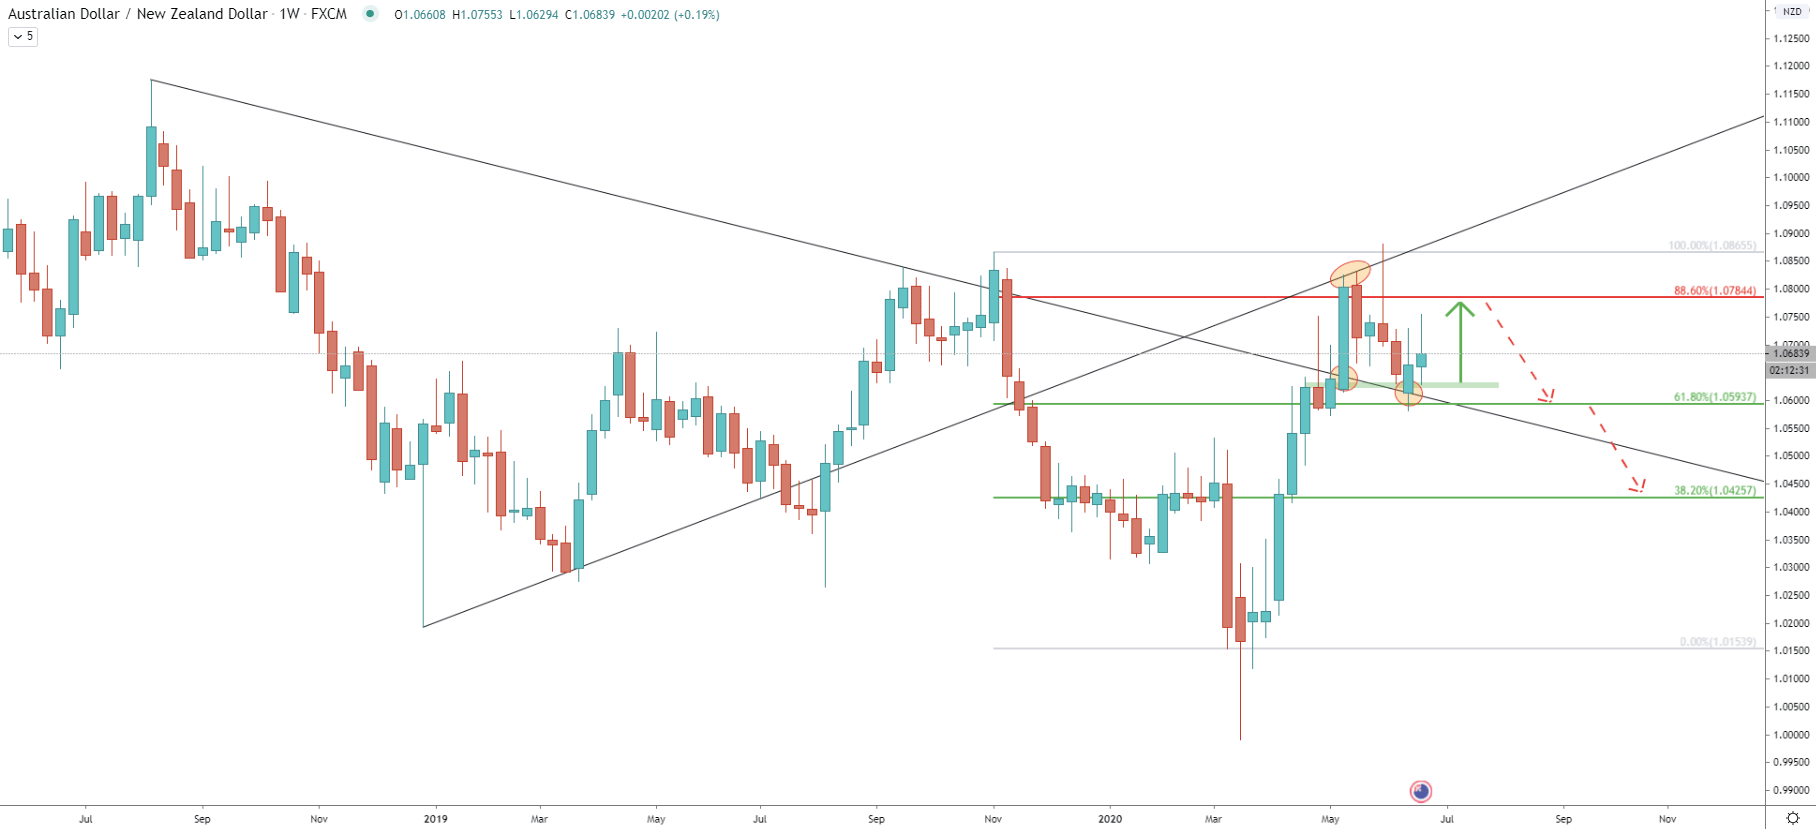
Now if we look at the current state of the situation on the weekly chart, it does look like the price could be reversing to the downside over the long run. This is because the uptrend trendline has acted as the resistance and was rejected cleanly. The was a spike produced above the point of rejection, although the weekly closing price remained below.
We have applied the Fibonacci retracement indicator to the last wave down, which was valid during the peak of the financial crisis back in February - May 2020. What it shows is the nearest resistance at 88.6% Fibs, which is a 1.0484 level. At the same time, it shows few support levels, 61.8% at 1.0593, and in case of a downtrend next downside target at 38.2% Fibs, which is 1.0425.
We can also see the downtrend trendline which has been broken and the past week has been acting as the support. Up until now, this support holds which might result in a relatively strong wave to the upside, before/if there will be a massive drop in price.
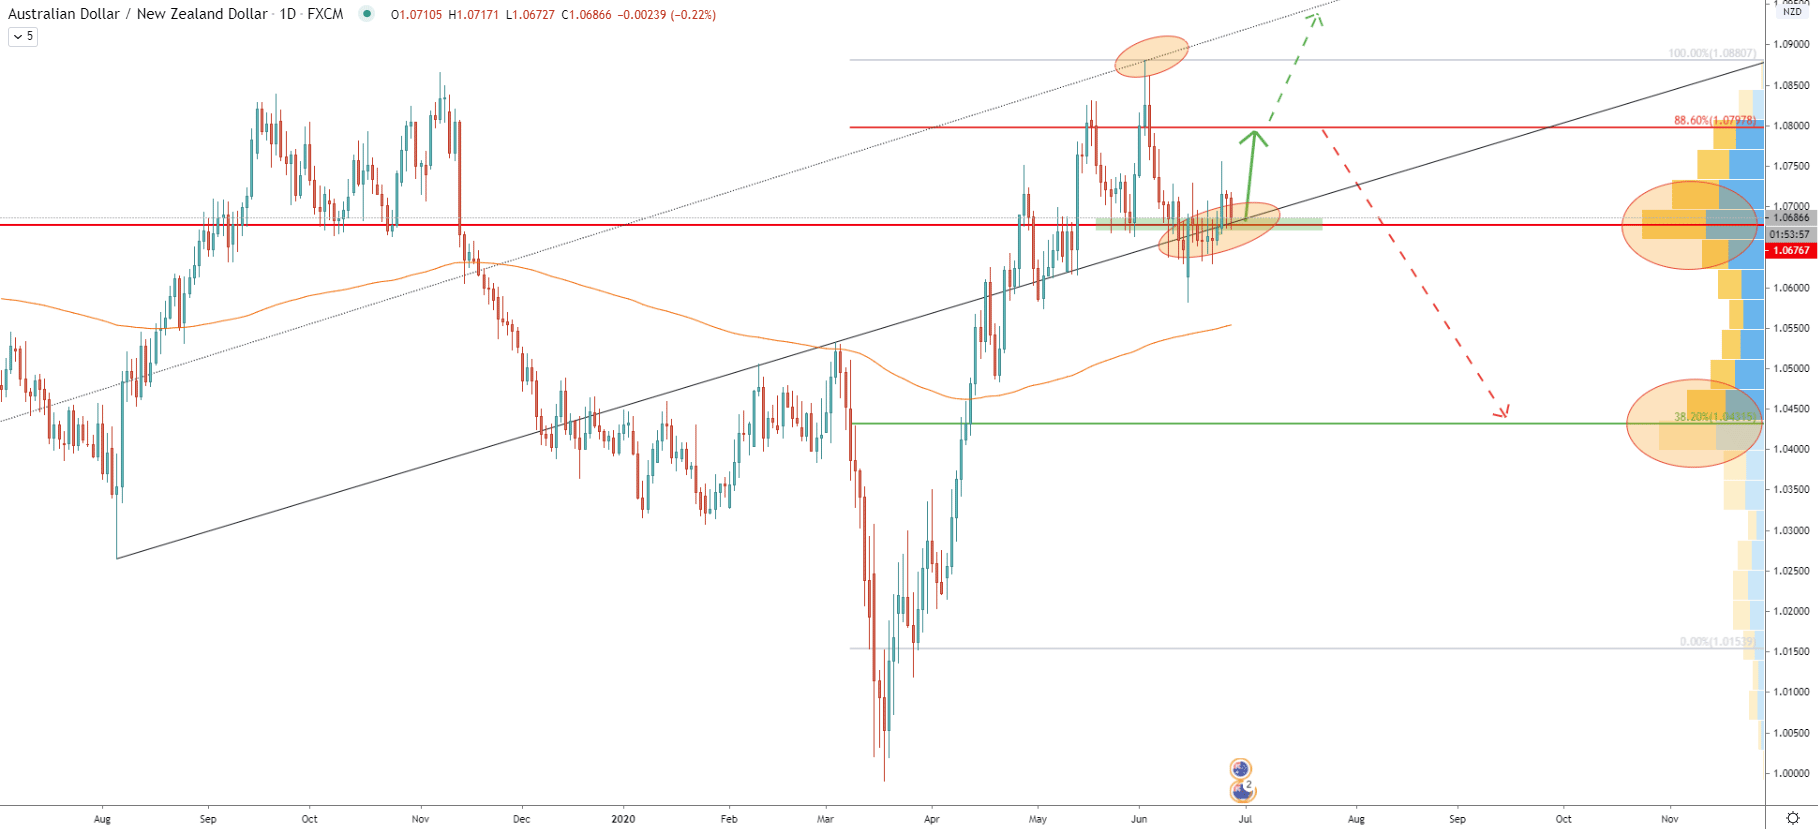
Moving on the Daily chart, the average-price uptrend trendline is being rejected throughout the entire week, while price remains above the 50 EMA. The important point here is the Volume Profile indicator level, which is pointing out to the 1.0676. Yesterday and today AUD/NZD rejected this level, along with the average-price uptrend trendline. It certainly looks like bulls are getting ready to step in because the 1.0676 support and the trendline could not be broken.
In regards to the downside, we can also see that the Volume Profile indicator cleanly corresponds to the potential downside target at 38.20% Fibs. But the downside scenario can only be considered if the daily and/or weekly closing price will remain below the 1.0800 psychological resistance.
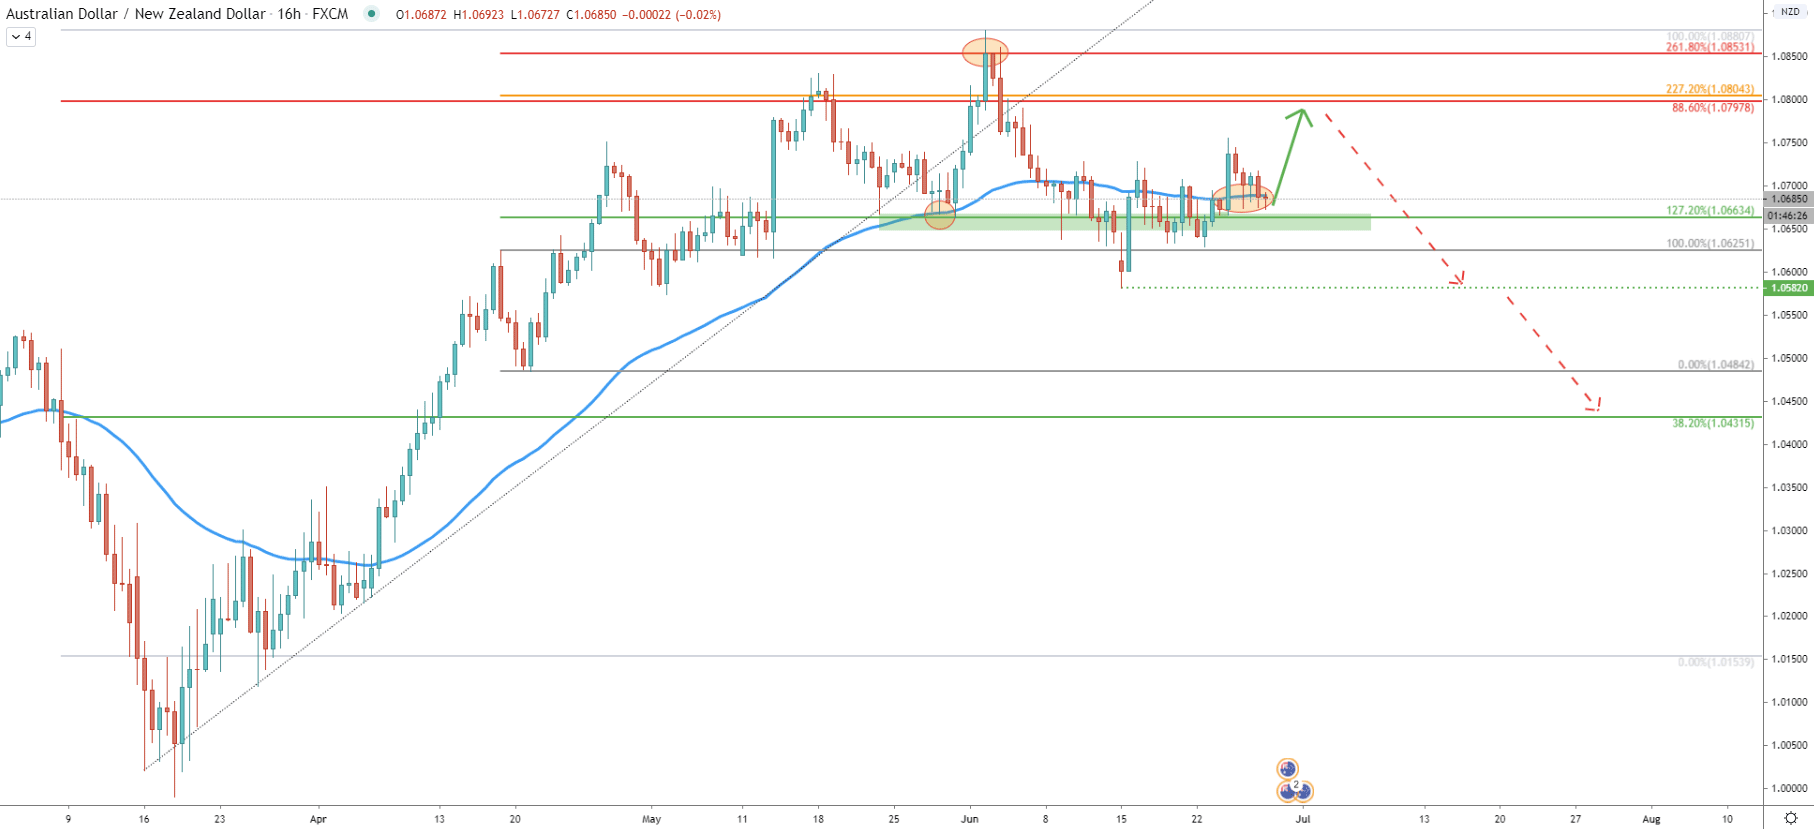
On the 16-hour chart, price found the support at 127.2% Fibonacci, which was applied to the first correction after breaking above the 200 EMA. AUD/NZD currently rejecting the EMA and struggling to break lower. Buyers remain in control and as long as 1.0663 is respected, the price can be expected to move towards the 1.0800 resistance area. In this chart, the resistance is also confirmed by the 227.2% Fibs.
Another important point is the bounce off the 261.8% Fibs at 1.0853, which goes to show that in the long run price might be getting ready to reverse down. But overall, we are looking to see just one more and perhaps the final wave to the upside, before/if AUD/NZD will reverse to the downside.
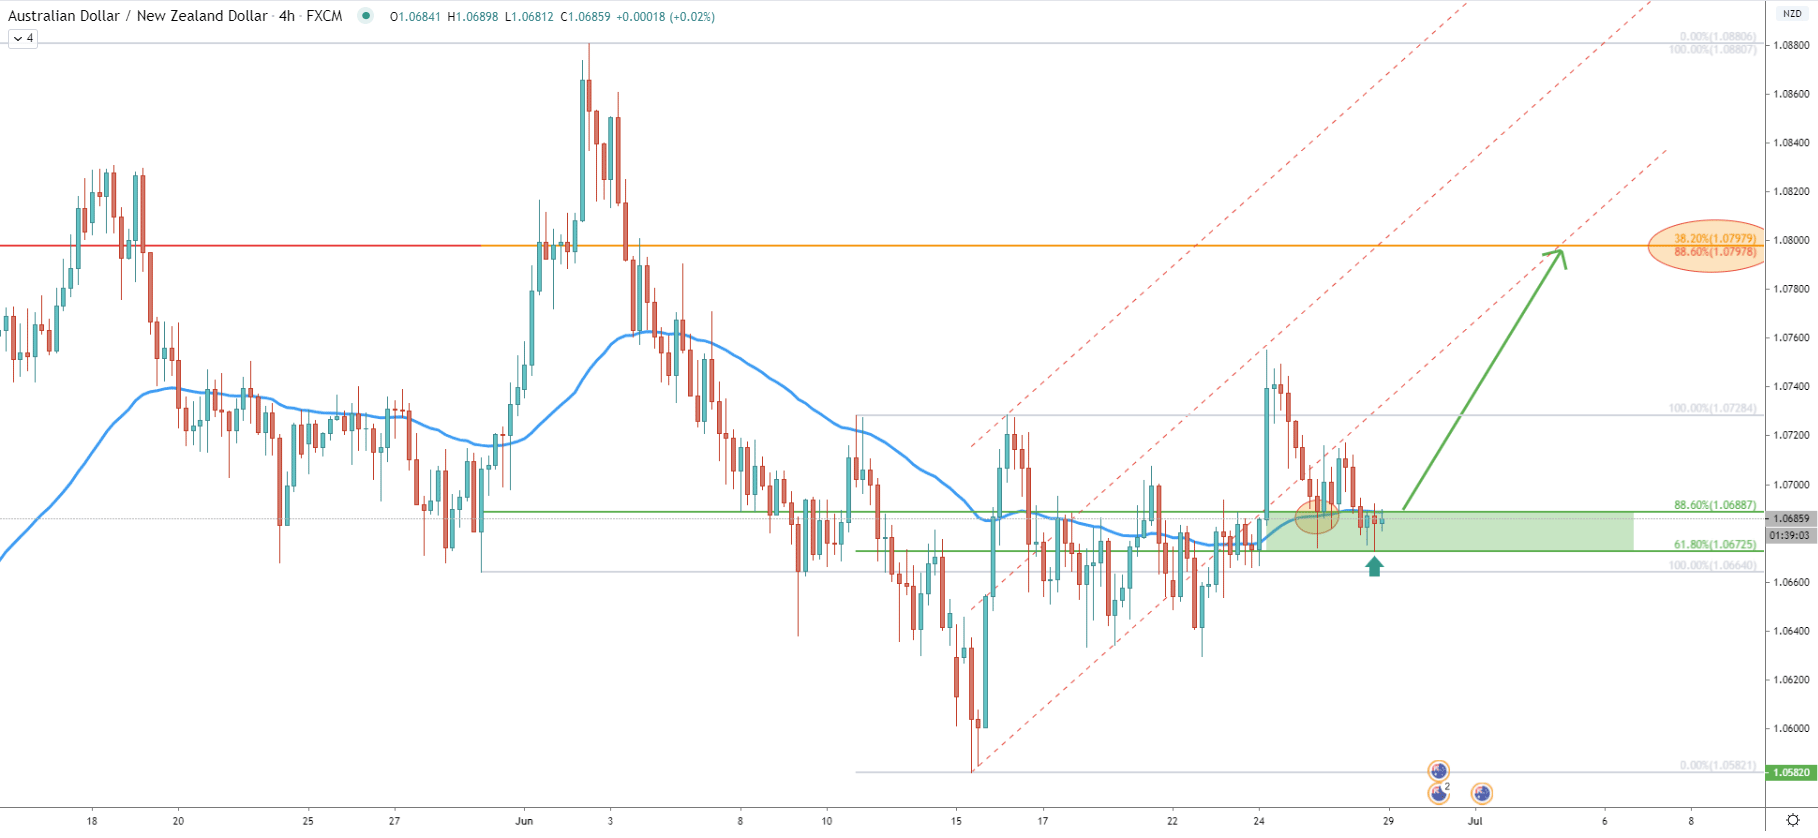
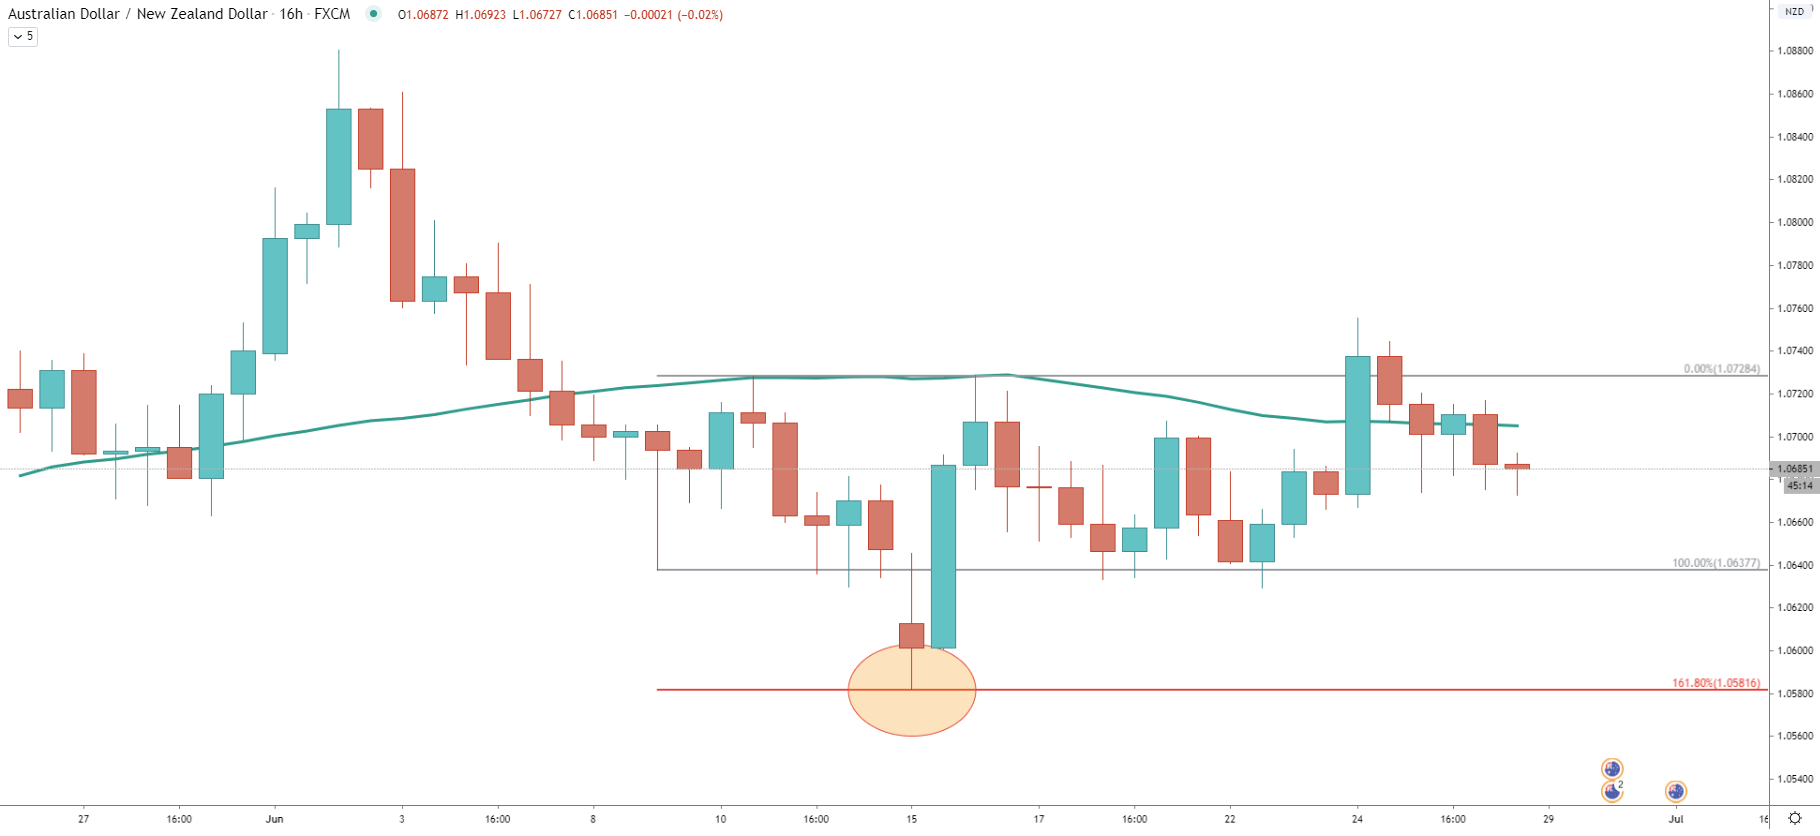
Here we have applied the Fibonacci retracement indicator to the last wave down, where 1.0582 low was tested. Today AUD/NZD has reached and rejected cleanly 61.8% Fibs at 1.0672, which could be a strong indication that the local bottom has been reached. There could be a price spike below the 1.0672 support, but as long as the 4h closing price remains above, AUD/NZD will move up.
On this chart the upside target also corresponds to the 38.2% Fibs, applied to the last wave up, when AUD/NZD topped out at 1.0880. And finally, considering the rejection of the support area, and the 50 EMA on the 4h timeframe, the short term uptrend scenario gains a very high probability.
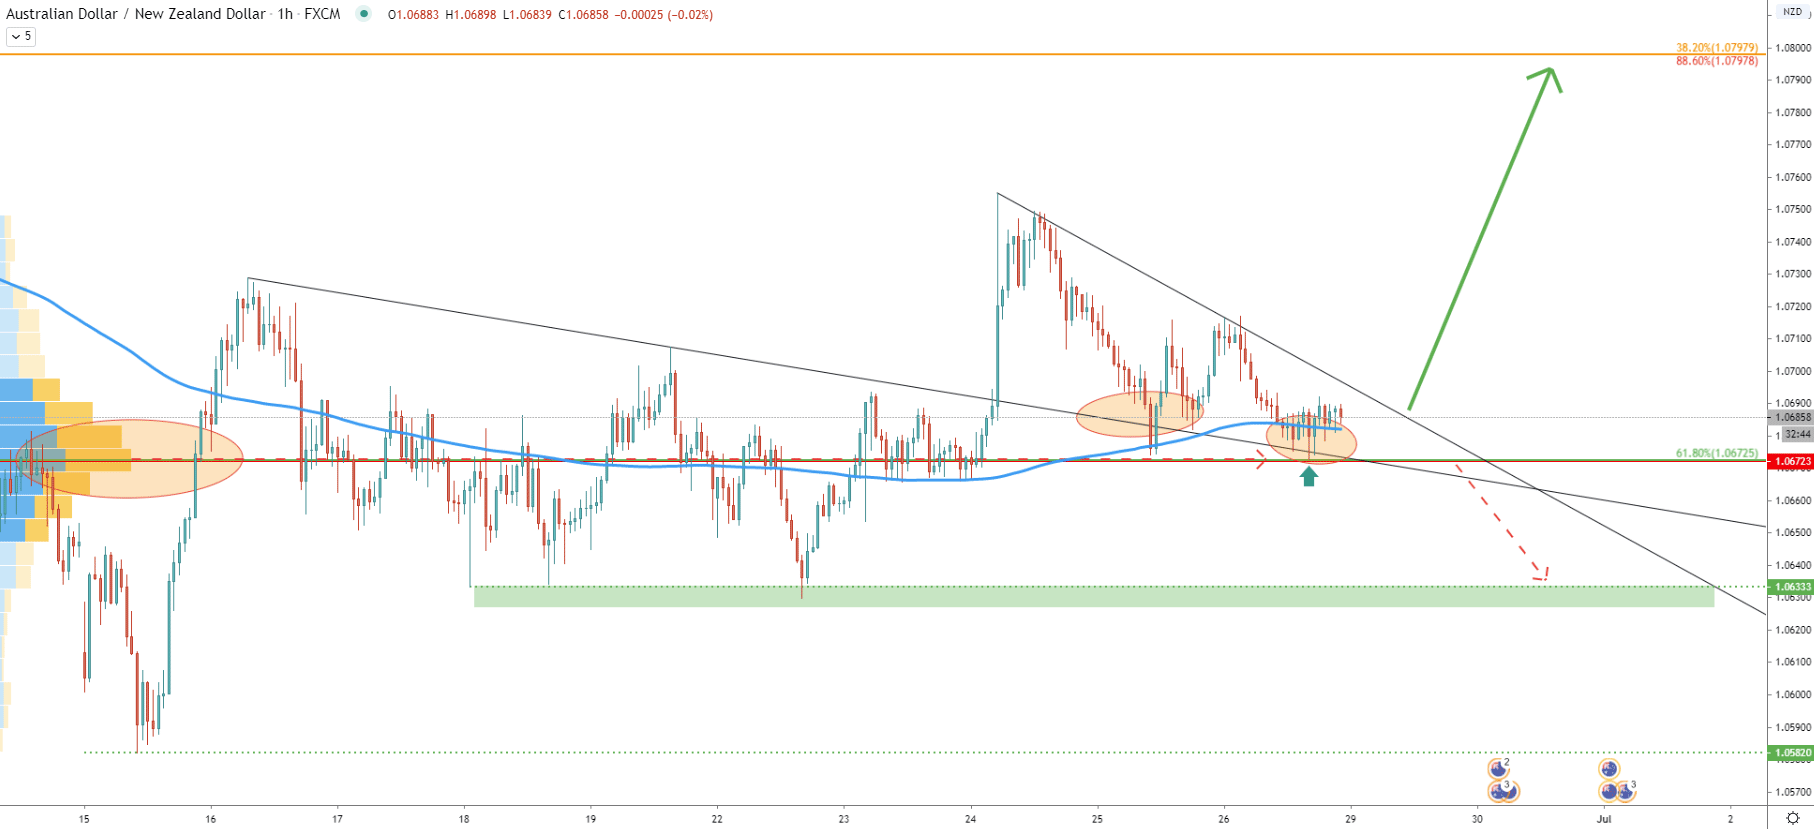
Yet again we are using the Volume Profile indicator, but this time on the 1h chart. Today price has reached and rejected the VP level at 1.0672 very precisely. Also, the 200 EMA was rejected prior to that, and the price still struggling to break and close below with confidence. Besides, the broked downtrend trendline is now acting as the support, although there is one more downtrend trendline to be broken for the final confirmation of the short term rally. When/if it gets broken, AUD/NZD can start moving up very fast. It seems like 1.0672 is in fact a key support level and a perfect buying area for bulls who want to have the best risk to reward ratio.
The AUD/NZD long term trend could be slowly turning from bullish into bearish. But in the medium to short term price is expected to produce yet another and perhaps the final wave to the upside.
Based on multiple Fibonacci retracement levels, the key resistance is seen near the 1.0800 psychological level, to be precise, it is 1.0797 level.
1h and 4h break and close below the 1.0672 support will immediately invalidate a strong bullish outlook. In this case, AUD/NZD can be easily expected to move towards the 1.0633 support area.
Support: 1.0672, 1.0593, 1.0425
Resistance: 1.0784, 1.0797, 1.0425