
Published: June 15th, 2020
The Australian Dollar continues to struggle against many fiat currencies as the correctional phase has been initiated. During the past couple of weeks, AUD has corrected down sharply especially considering the March rally. But it is still unclear whether the correctional phase has ended and AUD will continue domination across the board, or it will be a much stronger pullback on all AUD pairs. Tomorrow there will be a major news release on AUD, specifically, RBA Meeting Minutes. This should result in increased volatility as well as the establishment of some direction by the Australian Dollar. Let’s observe AUD/NZD to better understand where the news might drive the pair.
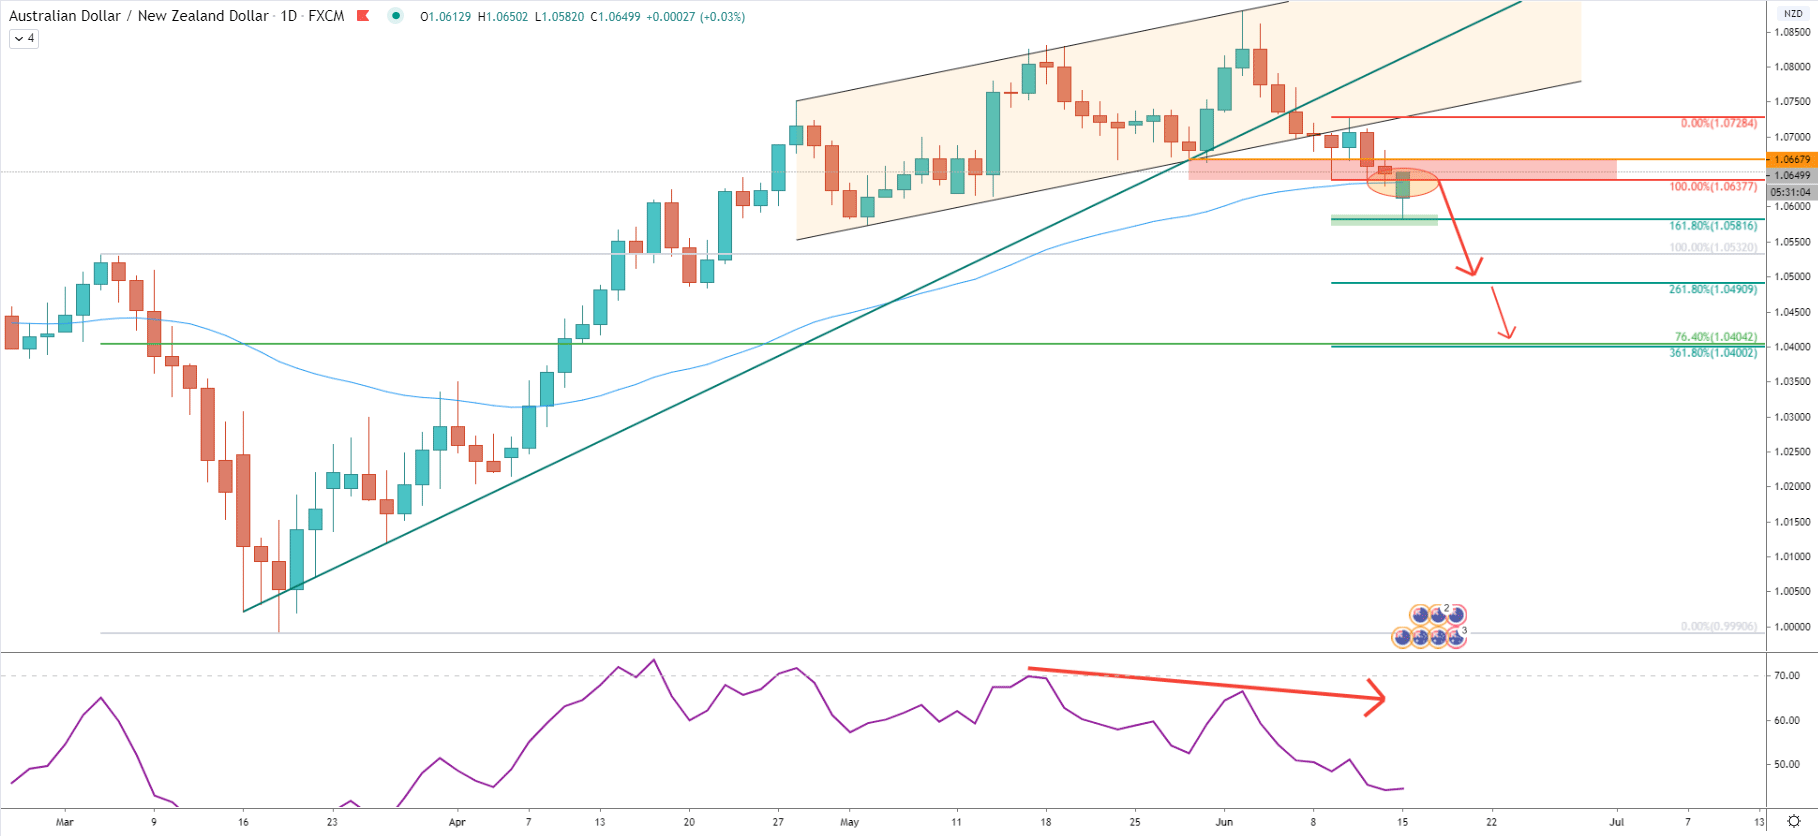
On the Daily, chart price has been trading within the ascending channel for over a month. While trending up and producing higher highs and higher lows, the RSI formed a bearish divergence. Then, on June 9, AUD/NZD finally broke below the channel as well as the uptrend trendline, suggesting strong selling pressure in the medium term. Pair went down, broke the 200 Exponential Moving Average, but rejected cleanly the 161.8% Fibonacci support level at 1.0581. The Fibonacci indicator was applied to the corrective wave up, after breaking the channel, trendline, and the 200 EMA. It shows potential downside targets if the price will continue to move lower. The next target is seen at 261.8% Fibs, which is 1.0490. Then it is 361.8% Fibs at 1.0400, which almost precisely corresponds to the 76.8% Fibs, applied to the last wave down, occurred between 4-18 March. But will there be enough selling pressure to push the price that low?
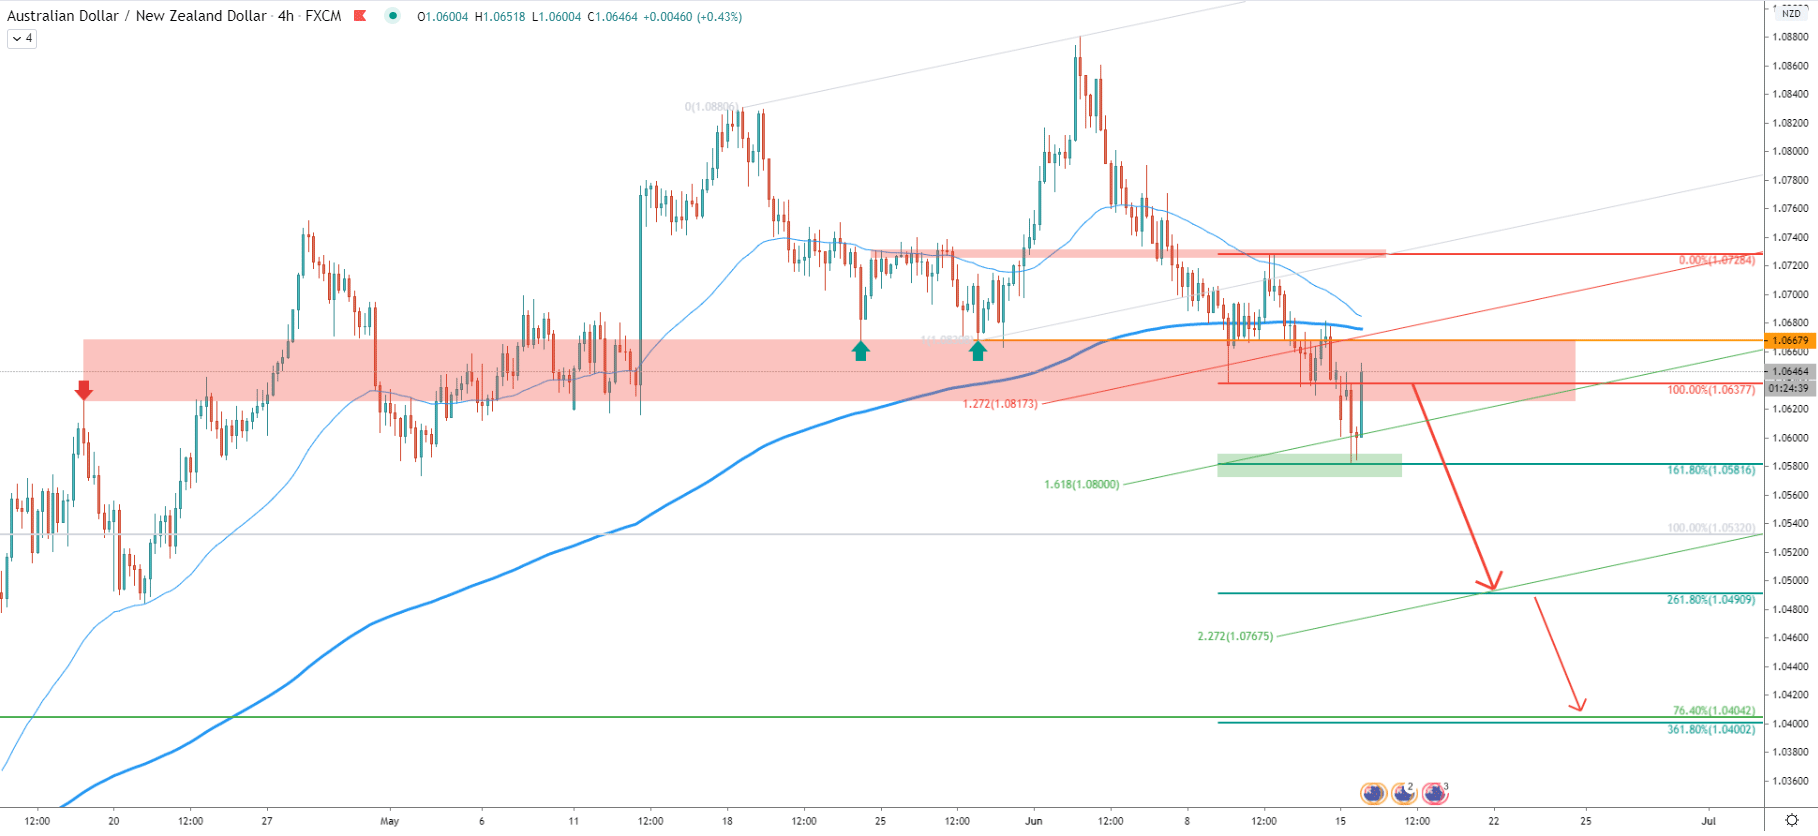
On the 4-hour chart, the bounce off the 161.8% is extremely obvious, along with that, the price also bounced off the 1.618 Fibonacci channel trendline. This goes to show, that there is extremely strong support at 1.0581 and the price rejected it cleanly. Nevertheless, the downside correction is ongoing and there is still the possibility of the selling pressure. But for this, AUD/NZD must break and close below the 1.0581 support and potentially correct towards the 1.0637, which will provide an ideal selling opportunity for the bears. But as long as the support holds, there is a good chance that the long term uptrend will continue. Perhaps at this stage, price should be expected to rise towards the previous resistance area near 1.0830, which is the high of May 18.
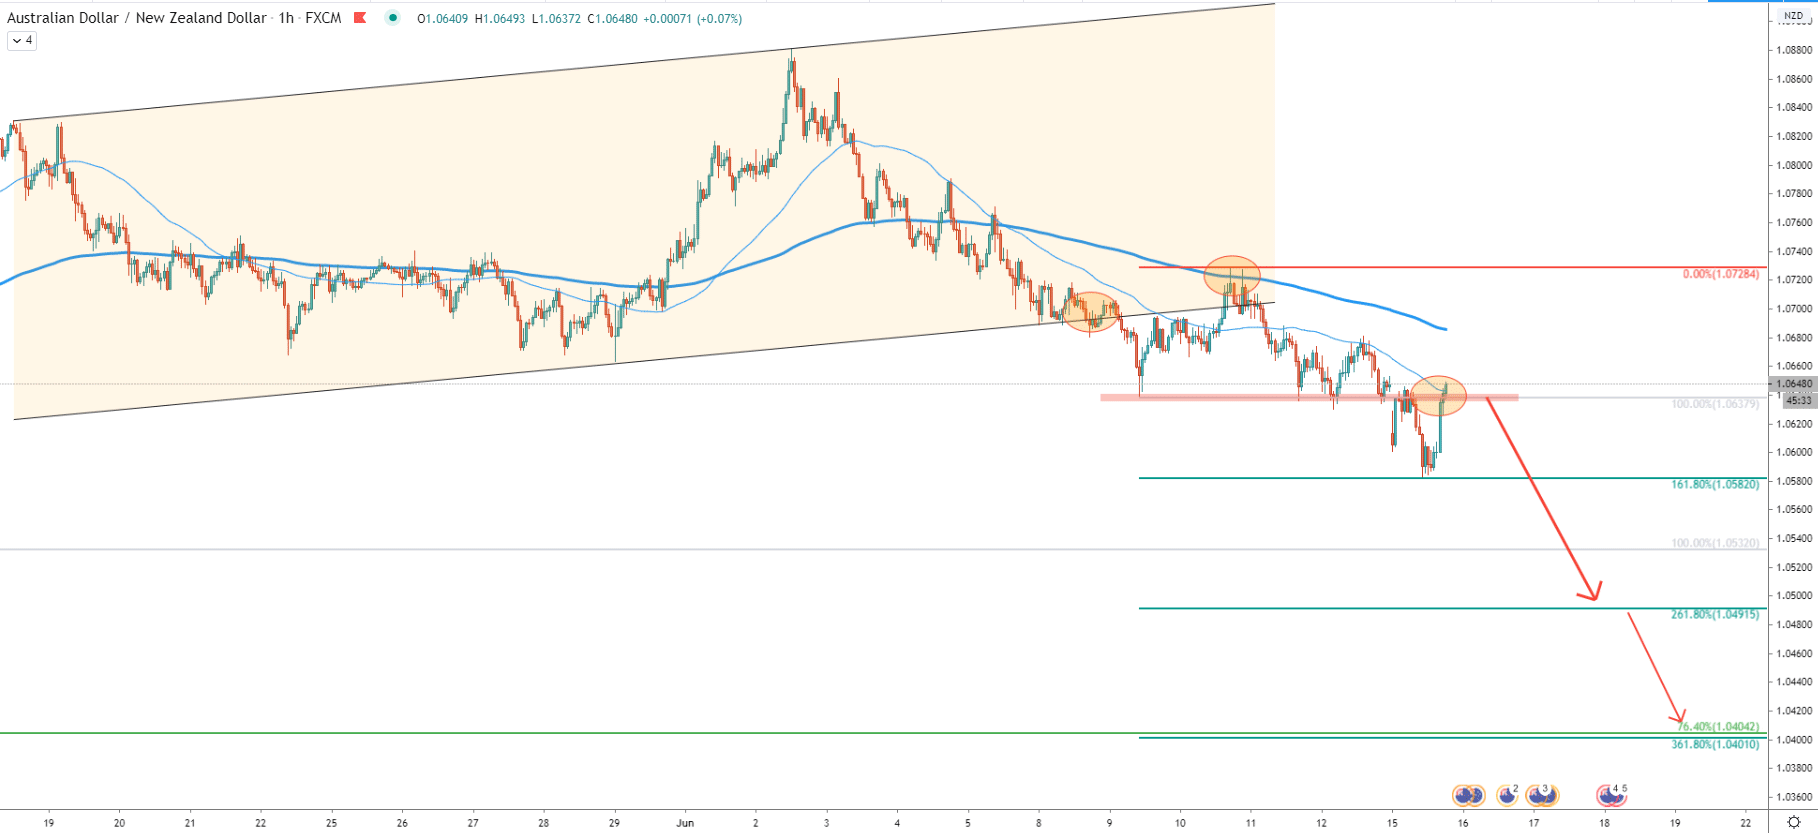
On the 1-hour chart, the price did break below the ascending channel. It went down, rejected the Fibonacci support, and corrected up. Now price is right at the 50 Exponential Moving Average, which might provide a minor resistance for AUD/NZD. On the other side, if this resistance will be broken, pair will continue to move north, with the nearest target being at 1.0728. This is the point where AUD/NZD rejected the 200 Exponential Moving Average, which is now a key resistance level in the short term.
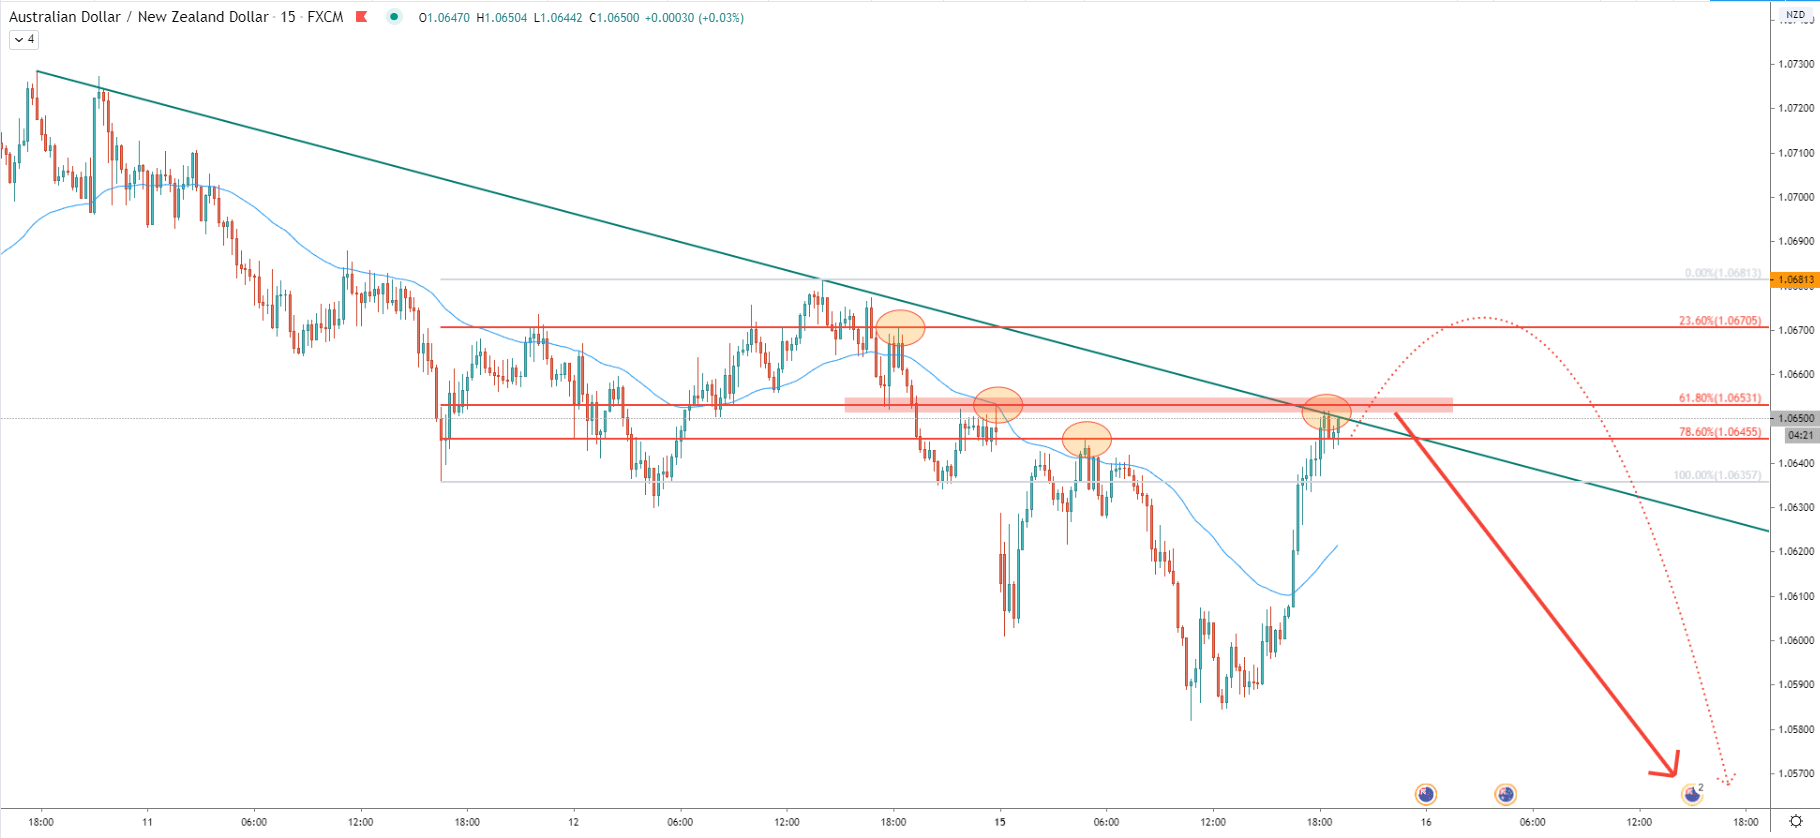
On the 15-minute chart, there are two scenarios that can be expected in the next 24 hours. If the current resistance level will be rejected, the pair can be expected to produce another lower low. If current resistance is broken, the price almost inevitably will move up to re-test 1.0670 level, which is 23.6% Fibonacci retracement level applied to the previous correction up. But break above this resistance, will invalidate any bearish outlook and AUD/NZD might initiate a strong move to the upside. All in all, it is better to wait and see what will happen to the current resistance and make sure that the daily closing price will remain below 1.0653. Only in this case, there will be a strong downside potential for AUD/NZD.
On the AUD/NZD, there is a mixed sentiment, it is hard to say with confidence whether the price will go up or down. But there are such facts as the clean rejection of the Fibonacci support, which strongly favors the uptrend. On the other hand, AUD/NZD is printing lower lows and lower highs and currently is trading at the minor resistance. Therefore, the Daily closing price below 1.0653 might confirm a short term selling opportunity. If the Daily closing price will be above, it will most likely suggest the strong AUD and after tomorrows’ news release, price should be expected to move up.
There are 3 downside targets based on the Fibonacci retracement levels. The first is the 161.8% Fibonacci support at 1.0582 which has been rejected today. Price still might move down and produce a double bottom at this area. But if AUD/NZD breaks to the downside, below the 1.0582, the next target is seen at 261.8% Fibs, which is 1.0490. And finally, the last target is seen at 361.8% Fibs, which is a strong psychological level at 1.0400.
Considering the rejection of the support, the uptrend probability remains extremely high, and it would be risky to initiate a selling trade if there was no clear break and close below the 1.0582 support.
Support: 1.0582, 1.0490, 1.0400
Resistance: 1.0728, 1.0653, 1.0670


