
The strategy to be discussed in today’s article is the 4-hour trendline break strategy, which uses the MACD cross confirm the break of a trendline in a secondary trend. With this strategy, traders can aim to pick a few pips from a highly filtered setup, using key price levels.
The indicators used in this strategy are as follows:
This strategy can be precisely described on a daily chart as it's probably the most useful chart of all that delivers a good number of pips, and at the same time captures the essence of a trendline break within the context of a secondary trend.
The key element of the strategy is to spot a situation on the charts where a trendline can be used to connect the highs of the price candles when the market is trending downwards, or the lows of the price candles in an uptrending market. Once these areas are defined using the line tool to trace at least three highs or lows, the trader looks for price to break the trendline. This trendline break signals a period when prices will move transiently in the opposite direction.
A previous support or resistance is sought and if this found close to the price area, draw a horizontal line. This allows the trader to visualize the V-shaped price activity that indicates attempts to stop hunt the rest of the market by institutional traders. This area is created by institutional traders trying to trick the retail traders into thinking a resistance is being broken to the upside, or that the support is being broken to the downside. In the actual sense, the trade direction is actually opposite to the stop hunt direction, and the trendline break simply adds confirmation that prices are actually going the other way.
A cross of the lines of the MACD indicator has to precede this trendline break (usually within the last three candles) and key areas of support or resistance are used as reference points for signalling trade exits. Vertical grid lines or the line tool can be applied to detect the MACD cross areas.
The MACD indicator used is not the same as that found on the MT4 platform. Rather, it is a modified version to which moving average lines have been added to enable the trader detect the filtering crossover signal and use it as an earlier signal of change of price direction. Furthermore, the MACD indicator is a leading indicator and hence the crossover should ideally precede the trendline break, but not by much.
Here is how to trade the trendline break strategy using the modified MACD indicator.
The long trade setup using this strategy is as follows:
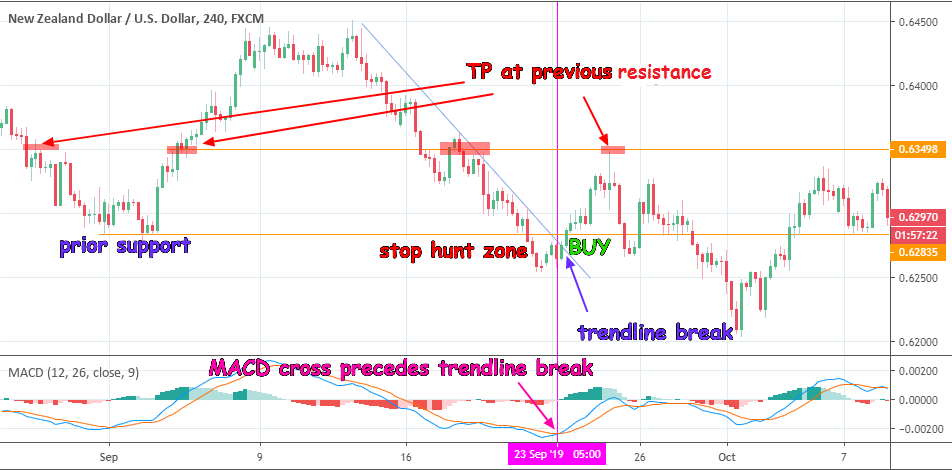
Trendline Break: Long Trade Setup
The Take Profit is set using the resistance area that is located immediately above the BUY entry area. The stop loss can be set below the support entry level, aiming to achieve a risk-reward ratio of 1:3 all the way up to 1:6.
Here is how to trade the trendline break strategy using the modified MACD indicator, with a short trade in mind.
The short trade setup using this strategy is performed as follows:
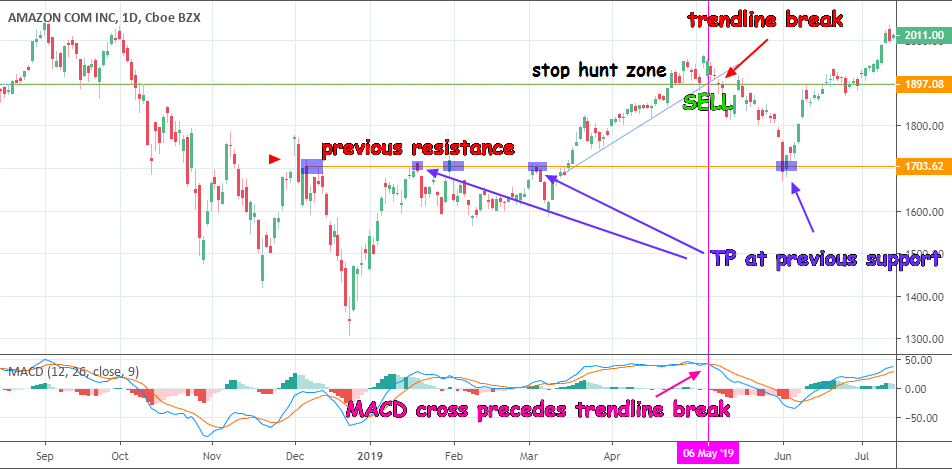
Trendline Break: Short Trade Setup
The trader should set the profit target price at a previous support which is located directly below the trade entry area. This support may be a previous resistance which has undergone role reversal to become a previous support, after prices pushed above it earlier. The stop loss is set above the line drawn across the previous horizontal resistance line.
We recommend to use Tradingview charts for this strategy so you can also get access to the customized MACD indicator used.


