Today’s strategy shows how to use other components of the Ichimoku Kinko Hyo to produce a tradable signal. This time, the strategy makes use of the Tenkan sen and Kijun sen to produce a trend-reversal signal. “Sen” means line in Japanese, so we essentially mean the Tenkan line and Kijun line.
The strategy is akin to a moving average crossover, but this one is known as the Tenkan-Kijun cross. This strategy involves the use of a 26-period forward plot of the Tenkan line and the Kijun line, to do a crossover signal setup. First, it is pertinent to define the two lines used in this setup.
The Tenkan line averages out the data for price highs and lows over the last 9-days. It works like a fast moving average, and is the line which is expected to perform the cross over the slower Kijun line. Watch out for the angle of crossover. The cross must be steep in order to indicate a true trend change. A flat Tenkan line is suggestive of a market that is about to go sideways, which renders this signal untradeable.
The Kijun line works like a slow moving average and indicates what the trend of the market will assume. Just like with the Tenkan line, the Kijun line must have a steep slope so as to show that the market will trend. A flat Kijun line indicates a sideways market, which also makes this strategy untenable.
So we need to have both Tenkan and Kijun lines sloping in a particular direction, with the Tenkan line completing a crossover for us to have a workable strategy that we can trade.
The Tenkan-Kijun cross (also known as the TK cross) strategy is best traded on higher time frame charts, as the signals generated on these charts produce more pips. Furthermore, the trend is better represented on higher order charts such as the daily charts.
Critical to the success of this strategy is the use of the position of the price candles/bars relative to the cloud component of this strategy (i.e. the Kumo). This is used as a trade filter, so as to prevent entering a trade simply on the basis of a cross, only to discover that the market is actually consolidating and not trending. How can the price position relative to the Kumo help filter the signal?
If the price bars/candles are located above the Kumo, then the sentiment in the market favours an uptrend and a TK cross to the upside can be traded with a long trade. If the price bars/candles are located below the Kumo (the so-called overcast formation), then the market sentiment favours a downtrend and TK cross to the downside can be traded with a short entry.
If the price candles are located within the cloud, this is a sign of market consolidation. At this stage, any TK cross signal should be ignored as it may likely end in failure.
In the words of Hosada, the inventor of the Ichimoku indicator, signals from the Ichimoku can be described as strong, medium or weak.
Therefore, only the strong signal should be used, and that is when the Tenkan line crosses the Kijun line, when price has already broken through the Kumo in the same direction.
The short trade occurs when the following is seen on the chart:
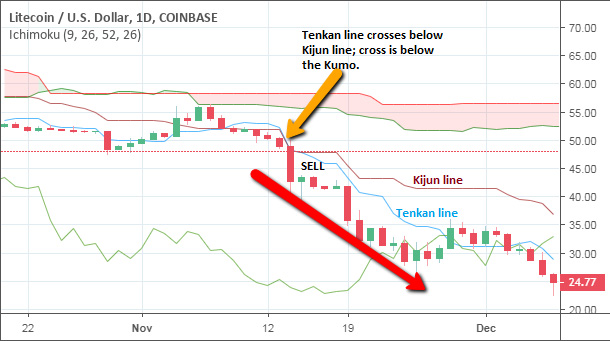
The daily chart for the Litecoin/USD crypto pairing illustrates this setup, in the daily chart posted below.

LTC/USD Daily Chart Showing Bearish TK Cross
Here, we can see that price was already below the Kumo when the TK cross occurred (strong signal). Typically, once price has crossed from the top of the Kumo to the cloud’s underbelly, it connotes weakness in the asset pair being traded. The cross merely provides further confirmation of the downward price movement. It must be noted here that downside movements tend to be very aggressive.
Stop Loss is set within the Kumo or on the opposing side of the Kumo, while the profit target is set using a previous support area. The risk-reward ratio used for the Stop Loss and Take Profit price levels should be 1:2, where a pip is risked as the stop loss for every pip being targeted as profit.
The potential for a long trade occurs when the following is seen on the chart:
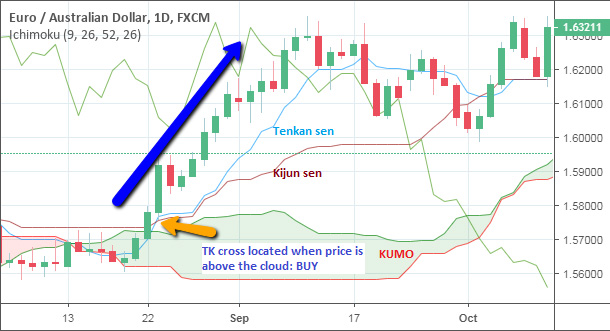
This is perfectly illustrated in the chart below, which is a daily chart for the EURAUD pairing.

EUR/AUD Daily Chart Showing Bullish TK Cross
Here, we can see that the momentum was bullish even before the TK cross occurred, as the preceding three candles were all bullish candles which had taken price above the Kumo. Price was already above the Kumo when the TK cross occurred (strong signal). The cross merely provided further confirmation of the upward price movement.
Stop Loss is set within the Kumo or on the opposing side of the Kumo, while the profit target is set using a previous resistance area. The risk-reward ratio used for the Stop Loss and Take Profit price levels should be 1:2, where a pip is risked as the stop loss for every pip being targeted as profit.