
Today’s strategy involves the use of the moving average indicator (various periods) as well as the Fibonacci retracement tool. This strategy is built to be an intraday strategy, but there are times it could extend into the next day before the trade objectives are fulfilled. The target profit usually does not extend beyond 30 pips.
Here are the indicators that are used for the strategy:
Other tools such as the support and resistance areas formed by the candlesticks will be used alongside these indicators to add a price action-based dimension to the mix.
The moving average indicators are single line indicators which provide a trend-based analysis for the currency pair you intend to trade. Moving average indicators are not usually used alone. They are used in pairs or in triples (i.e. two or three moving averages used together). The essence of using two moving averages or three moving averages is to filter the signals so that you do not have many signals which are inaccurate or too few signals which end up being too late to catch the market move. Therefore, it is only logical that for this strategy, we combine two exponential moving averages to create a tradable signal with fewer errors. So for this strategy, we use the 5-day moving average and the 10-day moving average. The moving average indicators are native to the MT4 platform.
The use of the 200-day moving average is to provide a dynamic support and resistance level that can be tracked on a long-term basis. This is a widely used support/resistance tool in the forex market because of its high degree of accuracy. This tool allows the trader to know when price action is approaching a dynamic support or resistance level. This level could be an area where price action experiences a turning point. As we shall show in this strategy, there will be occasions when the trader should either use the tool to avoid trade entry or use the turning point shown by the 200-day moving average as further confirmation for the trade entry. We shall showcase this in one of the three examples we shall show below.
The Fibonacci tool to be used in this strategy discussion is the retracement tool. The Fibonacci retracement tool will be used as the basis for the trade entry in this strategy setup. It is also a native tool found on the MT4 platform, and it is used by applying the two from 1 swing price level to another. In a downtrend, the Fibonacci tool is traced from the swing high to the swing Low of price action. In an uptrend, the Fibonacci retracement tool is traced from the swing low to the saying high of price action. When this is done, the tool will draw several possible retracement levels. These retracement levels are calculated from the Fibonacci numbers. the commonly used Fibonacci retracement numbers are the 23.6%, 38.2%, 50%, 61.8%, 78.6%, 88.1% and 100% level. To determine which of the retracement levels will be suitable for a trade entry, the trader should use the highs of previous candles to determine a resistance level that supports a short entry. In other words, the trader should use an area where the candles have formed a resistance as a possible short entry area if such a level matches a particular Fibonacci retracement level. In the same vein, the trailer should use an area where price candles have from a low and match this level to a particular Fibonacci retracement level to trade the price uptick that occurs from that level.
This strategy can be used on any asset listed on a forex platform. However, it is best used on currency pairs that are subject to short term trending, especially on the 1-hour and 15-minute time frames. There are many currency pairs that fulfill this condition. It is best you test the currency pairs yourself on a demo account so you know which ones work best with this strategy. Tests have shown that minor currency pairs, that is those that do not involve the US Dollar, usually fulfill this condition easily.
How does the strategy work? The strategy works by the correct application of the following three rules.
The first condition that must be fulfilled when trading with this strategy is that the two exponential moving average lines must cross in a particular direction. In other words, the 5-day moving average line must cross above the 9-day moving average line for us to get a bullish bias. Similarly, the 5-day moving average must cross below the 9-day moving average for us to get a bearish bias for the trade. This setup runs on the 1-hour chart.
The second rule has to do with the location of the 200-day moving average. The location of the 200-day moving average is ordinarily not important. However, if the price action is such that the moving average crossover mentioned above is close to the 200 moving average, then the 200-day moving average should be slightly below the crossover point if you are looking to buy the currency pair. If the trader is looking to short the currency pair, then it is desirable to have the 200-day moving average located slightly above the crossover point. That way, the trader can use the 200-day moving average as the turning point that favours the entry if prices retrace against the direction of the crossover.
The Fibonacci retracement tool is used to set up the trade entry on the 15-Minute chart. After setting up the other indicators on the one hour chart and the moving average crossover has occurred, the price candles are allowed to retrace against the moving average lines. The Fibonacci retracement to is applied on the 15 minutes chart from the nearest swing price levels in order to detect possible entry points. The Fibonacci retracement level that corresponds to recent highs (short entry) or recent lows ( long entry) is used as the entry point for the trade. The trade setups below demonstrate how to use the strategy to go alone or to short the currency pair.
The short trade setup is as follows:
Here is the chart snapshot showing this setup as well as the application of the various filters in place.
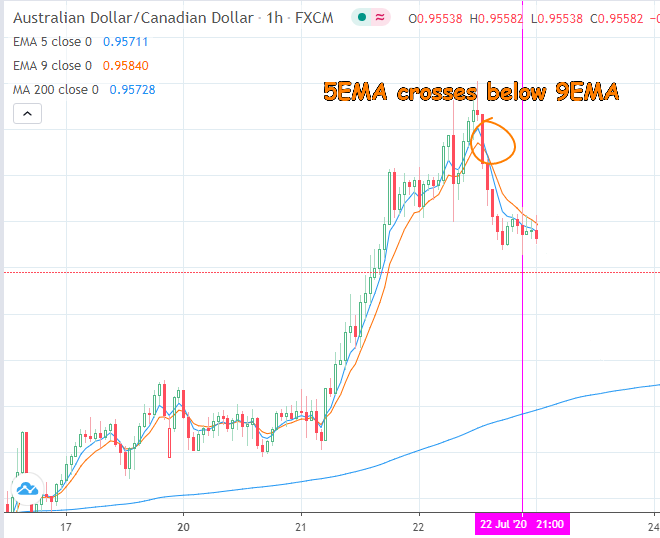
5EMA Crosses Below 9EMA on 1-hr Chart
Here, we can see that the blue line of the 5-day EMA crossed below the orange line of the 9-day EMA and then both lines started to head downwards. At some point, price began to retrace against the moving average lines. It is at this point that the traders should switch to the 15 minutes chart.
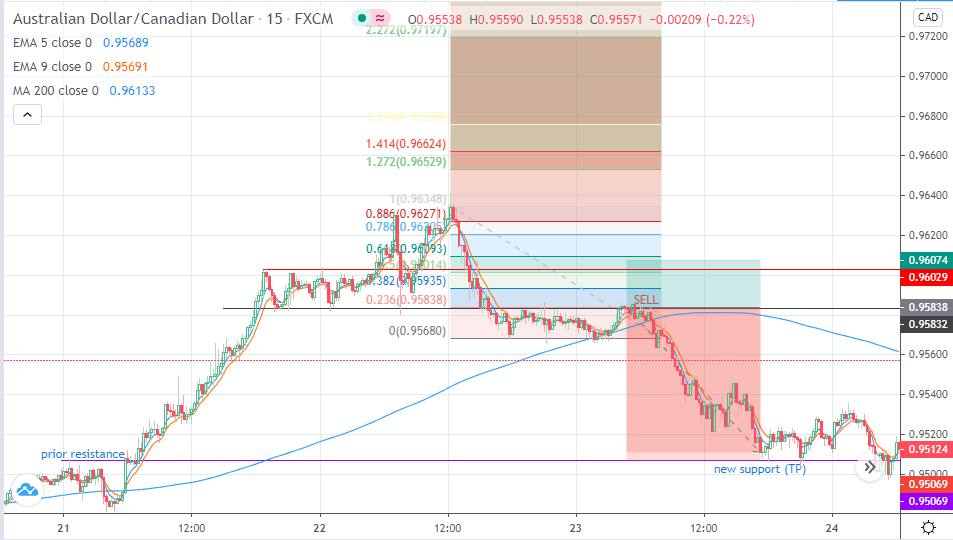
Short Entry on 23.6% Fibonacci Line
There is a previous resistance which was broken as price went upwards, on the left side of the chart. This is what forms the new support that will be used as the Take Profit point (0.95069).
The Fibonacci retracement was applied to the market top the previous day (the closest swing high) and traced down to the point where the downtrending price started to turn upwards. We can see that the 23.6% Fibonacci retracement level corresponded to a previous support which had been broken as price went downwards, thus forming the point at which the SELL trade was set up (0.95832). The Stop Loss was set above a previous area of resistance located at the 0.96029 price level.
In this instance, the 200-day simple moving average did not play a role in the trade setup until after the trade was active. At this time, the break of the 200-day moving average line by the price action confirmed the short trade entry.
The long trade setup is the opposite of the short trade and is set up as shown below. In this example, the 200-day simple moving average comes into play during the trade setup.
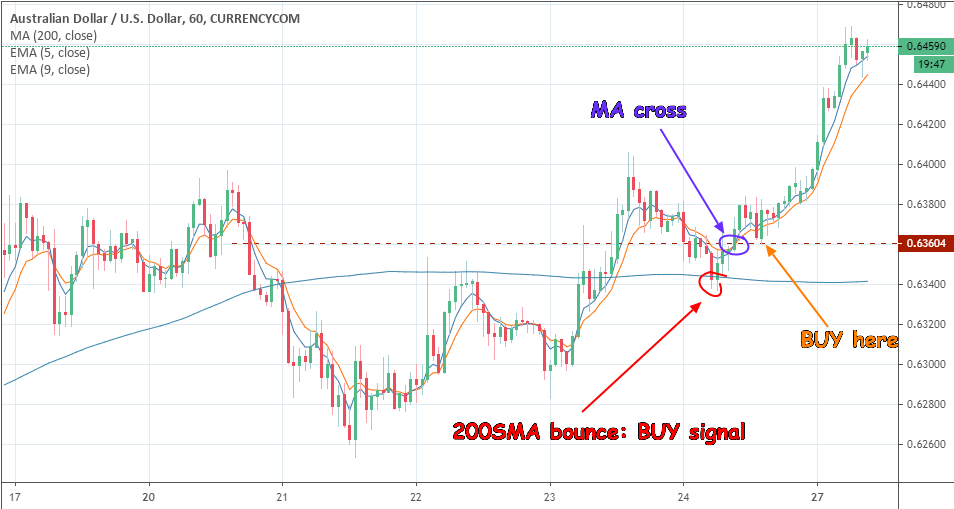
5EMA Crosses Above the 9EMA After A Bounce on the 200-day SMA: Buy Setup
Here, the bounce of the price on the 200-day moving average line confirmed even before the moving average crossover that the price will continue to go upwards. In this instance the use of the moving average crossover is to confirm the bus signal from the 200-day SMA and the use of the Fibonacci retracement tool is to get a suitable trade entry point.
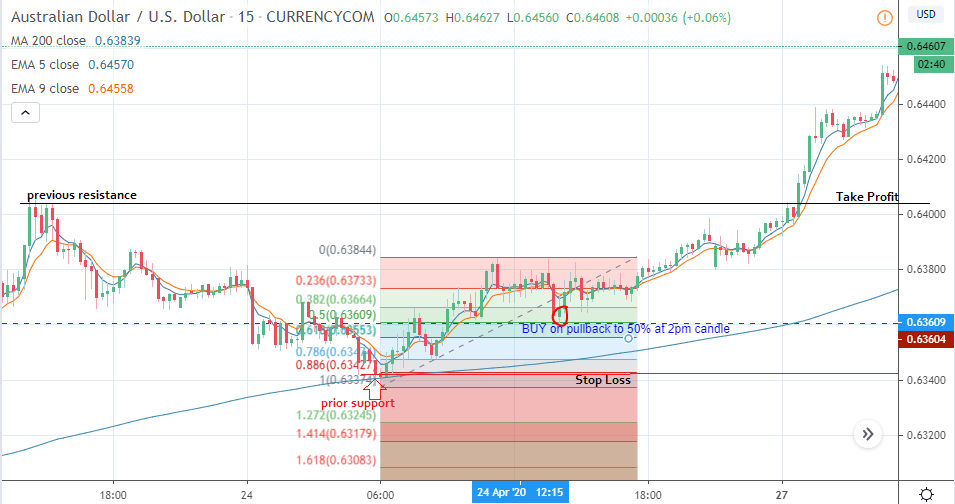
Fibonacci Retracement Long Entry on the 50% Level
On the 15 minutes chart, we can see that the price action retraced to the 50% Fibonacci retracement level at 0.63604. If you look closely at the chart on the left hand side, you will see that this was an area where the price had previously found resistance until the upward price action broke above this level and turned this resistance to a new support. This new support was the 50% Fibonacci retracement level and that is where the BUY entry should be made.
The Take Profit level corresponds to a previous resistance that you can see on the left side of the chart. The stop-loss is set below an area where previous support was found towards the lower end of the chart. Incidentally, the 200-day moving average on the 15-Minute chart intersects this area, which confirms it as a valid stop loss level.
This has been a description of the moving average crossover strategy which deploys the Fibonacci retracement points as the entry tool. Practice this strategy on your demo account until you gain mastery of it.


