What is a short covering rally strategy? This is a strategy that is deployed to take advantage of the resumption of a downtrend after institutional traders must have started to take profits off the table. As the name implies, this strategy is used for short trades only.
The answer is quite simple. Anyone with experience trading forex will immediately tell you that price drops are usually more aggressive than price gains. The gravitational laws as described by Isaac Newton have proven that it takes quite some force to throw an object upwards than it does to simply let it drop to the ground. It is the same with financial markets. You need more buying interest and volume to initiate upside moves than you would need to initiate downside moves. So when institutional players are shorting a currency pair, the moves can be huge and you can now benefit from these huge moves using the short covering rally strategy.
This strategy also utilizes the wave theories in price action, which state that prices never move in a straight line, but flow and ebb like the waves of an ocean. Each ocean wave is also made up of smaller wave patterns, known as ripples. So also is price action made up of waves and ripples of price movement.
The strategy is best implemented on the daily chart. No indicators are used but on occasion, the Fibonacci retracement tool can be used synergistically with the inside bar formation to get a trade entry.
A successful implementation of the short covering rally depends on the following:
A) Proper identification of a market in a downtrend (the easy part).
B) Identifying the covering rally.
C) Identifying the inside bar formation during the rally.
D) Setting up the trade using an appropriate order type.
Most of us can identify a market in a downtrend, so this really should not be a problem. However on occasion, you may need to trace the Fibonacci retracement tool properly. So you need to identify the most recent swing high (where the downside movement began) and the most recent swing low. Your trace tool should do the rest of the job by marking the levels on the daily chart.
The covering rally is seen as a V-shaped change in price direction to the upside, which is caused when institutional traders start offloading their short positions. This is usually a sharp pullback that looks like a V-shape and not a U-shape.
At some point in the recovery rally, the appearance of a 2-candle formation known as the inside bar formation is a signal that the covering rally is about to come to an end because the same big dogs who were offloading their shorts are preparing to re-enter at better prices.
So what is an inside day candle formation?
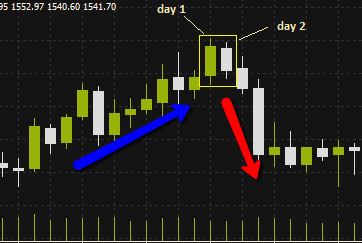
An inside day candle formation is seen when the highs and lows of the 1st candle (day 1 candle) envelopes the highs and lows of the candle that follows it (day 2 candle). In other words, the daily range of the day 2 candle is contained inside the day 1 candle. Any upper and lower shadows of both candlesticks are not considered in the calculation.

Inside day candle
After identifying the inside day pattern, the order is setup in such a way as to let the market momentum carry your trade along. You may liken this to placing an object in the path of a sea current, so that the current carries the object in the same path that it is going. The way to do this in the financial markets is to use a Sell Stop order. That way, the price action would be allowed to carry the trade order as it moves. This eliminates the false entries that could be caused by “bear trap” setups.
The Sell Stop order is placed just below the lowest point of the inside day candle formation. As you can see in the snapshot above, an inside day candle that follows a recovering rally usually triggers a downtrend resumption. So the candle that follows the chart is expected to trigger this entry and keep sending it south until the profit target is reached.
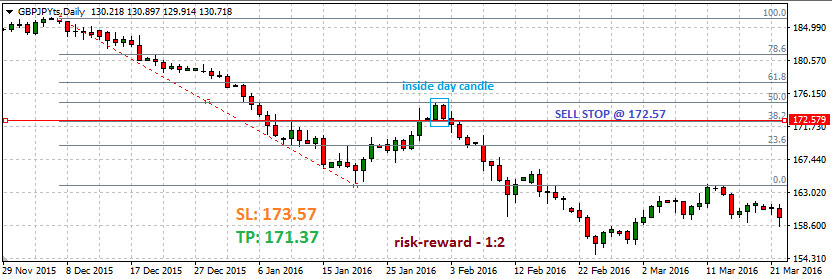
The snapshot below shows an example of a classical short covering rally. Here, we see that prices started to rally and actually hit the 50% retracement level of the Fibonacci trace from the 8 December 2015 swing high, to the 15 January 2016 swing low at that time.

GBPJPY Short Covering Rally
Once the inside day candle was identified, a sell stop was setup at 172.57, which was some distance below the inside day candle formation. The Stop Loss used was 60 pips above the entry price. This was necessary to give the trade room to operate, since the trade was taken off the daily chart. The profit target was set at 120 pips below the entry price, at 171.37. This provided a risk-reward ratio of 1:2.
As can be seen from the chart, the trade was a great one which even surpassed the profit targets. But the big questions typically arise on how the management of the trade is performed. What does a trader need to do while the trade is in progress?
A) One method is to use a trailing stop to follow the trade once it is in good profit territory. However, this may severely limit profits if the market starts to ebb against the position. Do not forget that the chart is a daily chart and for each daily candle you see, a lot is happening on the shorter-term candles that make up the day’s price action. There are a lot of ebbs and flows.
B) Some traders decide to close half the position when they have made some good profit. They then adjust the stop loss to the entry price to put the remaining position at breakeven. What is left of the trade is then allowed to play out to its logical conclusion.
C) Using the correct trade size and risk-reward ratios are critical to the sustainability of this strategy over time. You should never seek to make anything less than 2 pips as reward for every pip risked as stop loss.
D) Trade size should not exceed 3% of the total account size.