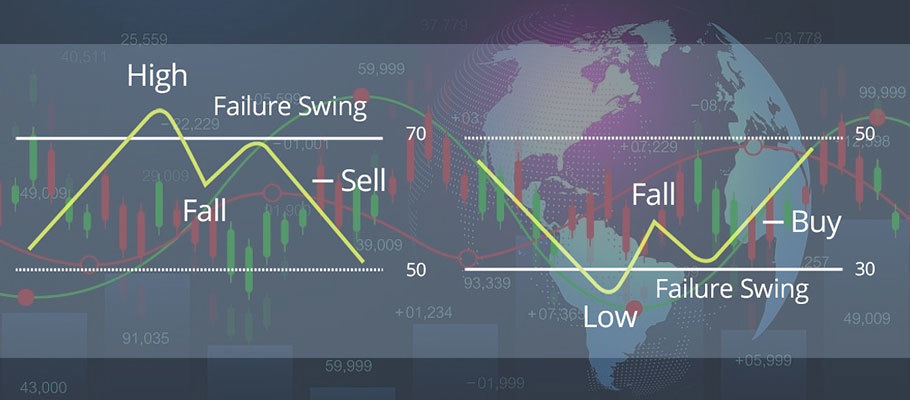
The failure swing is a forex trading strategy used to detect areas where the trend momentum is dying out, preparatory to a reversal in the trend.
The defining factor in a failure swing setup is that the primary trend does not meet new highs in an uptrend and fails to meet new lows in a downtrend.
The concept of the failure swing is a spinoff from the Dow Theory. As postulated by Charles Dow, one of the tenets of this theory is that the existing trend will continue until there is an apparent reversal. Price never continues in a trend forever. A trend will exhaust itself at some point, and the new trend starts in the opposite direction.
A trend change occurs as a result of the following factors:
Whatever the reasons for the trend change are, the trader has to recognize when the trend change is occurring and needs to do this early to catch the trend reversal before it takes off and makes it harder to secure good entry points.
One of the ways this is done is by identifying the failure swing. One indicator that makes it easier to detect the failure swing is the Relative Strength Index (RSI). The RSI is an oscillator, as it can see the amplitude of price momentum. It is also a leading indicator, which means that it shows the direction of price movement or a change in the trend before the price does. This factor makes the RSI an invaluable tool in detecting trend changes.
The failure swing is used to identify and trade moments of trend exhaustion. It is one of the earliest signals that the trend is failing, enabling the trader to make an early entry and pull off trades along a reversal.
The failure swing works in bull and bear markets. However, the signal generated by the failure of the swing in an uptrend produces more aggressive moves.
What are the steps involved in setting up a trade based on the failure swing?
Here are examples of how the failure swing is deployed.
Below is a 4-hour chart for gold (XAU/USD), which details the failure swing in an uptrend. We can see the failure swing of the RSI indicator, with the 2nd peak failing to attain the overbought price area. Also of interest is the initial bullish candle with a long upper shadow. This indicates that upward price action on that candle was rejected hard by sellers. This was an early warning sign. Subsequent highs of the other two candles that followed were progressively lower, indicating the increasing difficulty of the bulls to sustain any uptrend. Collectively, the three candles showed progressively lower highs, which was a clear indication that the uptrend had stalled.
The next action here was to detect the potentially best area for a price entry. The entry setup presented itself as a breakdown of the previous resistance that became new support by a break of this line by the bullish candle with a long shadow. Once the support line was broken, this was a sign that the momentum had swung towards the bears.
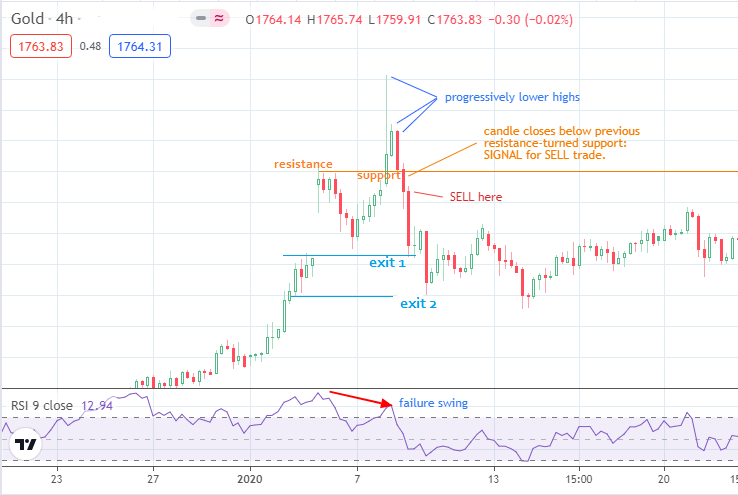
Failure Swing: Sell Entry
The SELL trade is initiated at the open of the next candle, with the trade exit set at any of the two exit points, which both represent previous support levels (blue horizontal lines). Here, the Sell entry is at 1575.12. The Exit was done at 1560.56. This was a profit of $14.56. A trade of 0.1 lots would have produced a profit of $145.60, while a Standard Lot trade would have earned $1456.00.
For the buy trade setup, we look at the daily chart of the EUR/USD. Note the previous support (orange horizontal line), which was violated by a bearish candle. However, two Doji candles emerged, indicating indecision on the part of buyers and sellers. The second doji appeared on the chart just as the failure swing pattern on the RSI indicator appeared. Following the second Doji candle was a bullish candle that closed above the previous support line.
The next candle was the entry candle. Here the entry was timed to coincide with an attempted pullback to the support line, where the price bounced. This bounce area on the support line is the buy entry price mark. Upon entry, the trade is followed until the price reaches a previous resistance point (like it did here). This point marks the exit point of the trade.
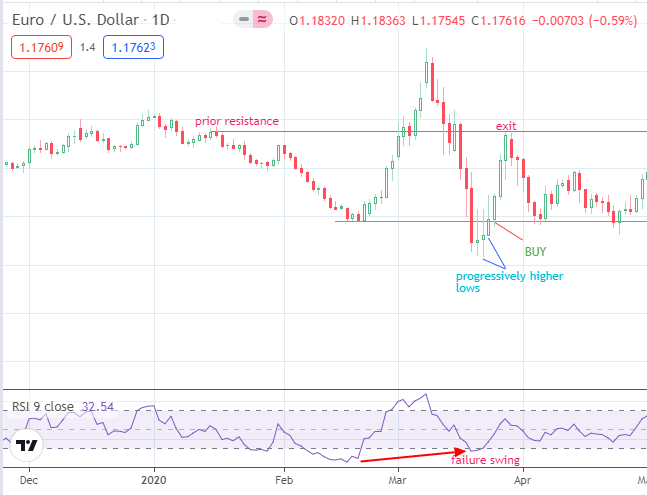
Failure Swing: Buy Entry
This trade went a whopping 359 pips after entering at 1.07877, and the trade was closed at 1.11468. A potential stop loss could be set below the support line where the bounce occurred, while the Take Profit Point is set a little below the resistance line above.
These two examples showcase how to use the failure swing pattern to produce accurate trade signals, especially when combined with good trade entry and exit points.


