
The rounding pattern reversal strategy uses a chart pattern known as the rounding patterns to create a strategy to trade price reversals. The strategy is based on the rounding top and rounding bottom, which sometimes occur after prolonged trends to signal the end of an uptrend or downtrend respectively.
Rounding patterns are fairly common on forex charts, and due to the fact these patterns have clear cut rules for trade entry and exit, they can be used to good effect.
There are two rounding patterns: the rounding top and rounding bottom.
A rounding top occurs when an arc can be used to delineate the highs of price action in an uptrend, causing it to resemble a curved lid. This arc or curved lid can then be likened to a cap which limits further price ascent, thus forming a resistance.
The lows of the price candles that form within the area covered by the rounding top usually do so within a particular horizontal price zone, which allows a horizontal line or box to form a support line. It is the break of this support line/zone that constitutes the entry signal for the rounding top pattern.
A rounding bottom occurs when an arc can be used to trace the lows of the price action in a downtrend in such a manner that this arc resembles a saucer. This saucer therefore restricts further price descent and provides the basis for a price bounce which signals a bullish reversal.
The highs of the price candles that form within the area covered by the saucer-like rounding bottom usually cluster within a particular horizontal price level or zone, which allows a horizontal line or box to be drawn to identify a resistance line/zone. It is the break of this resistance line/zone that constitutes the entry signal for the rounding bottom pattern.
The only indicator used for the strategy is the arc tool and the line tool, used in demarcating both the rounding patterns and the support/resistance barriers constitute the neckline. The strategy works best on the daily time frame and longer time frames.
The start point of the strategy is to demarcate the rounding patterns by tracing the arc around the price highs and lows that form the top/bottom respectively.
For the rounding top, the trace starts from the minor resistance and is taken up to connect at least two areas where the price has made highs. This trace is now extended around the highs until the other end of the arc is at the same horizontal level as where the original trace started.
For the rounding bottom, the trace starts from a minor support on the left side of the price candles, and is extended down to the lower lows, and back up to the higher lows that complete the curve to form the saucer.
At the end of the traces, there should be curved lines connecting the highs (rounding top) and the lows (rounding bottom).
The next step is to identify and use the trend line tool to draw a horizontal line across the price lows/highs of the candles that are contained within the “rounding” arc. Where it is not possible to use a line, a box can be drawn to identify “zones”, which form a range of price support or resistance that constitute the neckline.
The long trade is performed using the rounding bottom. The following conditions support a long trade entry.
Set the stop loss below the neckline, and set the profit target (Take Profit) at an area of a previous resistance, above the neckline.
The chart below showcases a typical setup for a long trade entry using the rounded bottom.
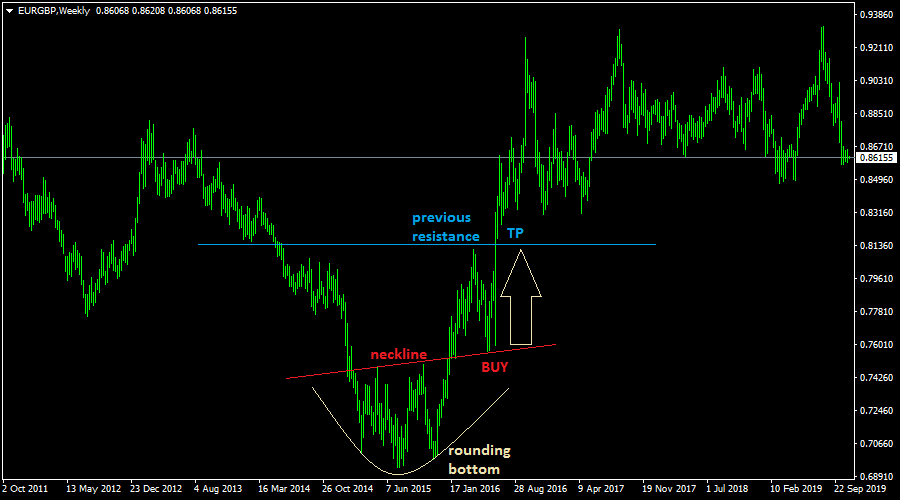
Here, we can see that the rounding bottom enclosed a set of lows, a lower set of lows and a higher set of lows. The neckline is the horizontal line connecting the highs of the candles fond within the rounding bottom. Then there is another line above this: this is the line that should connect areas where price made previous highs. Draw this and extend it to the right: this is where you set the TP point to exit the trade.
You can see from the chart that the reversal was indeed a very strong one. But you can also see that after initially hitting the exit point, price began to retrace again. This is a warning to users of this strategy that the use of a previous resistance as the exit point of this trade setup is not there for nothing. You have to use it because once price gets to this point and starts to back off, you cannot be sure where that sort of thing will take you. Don’t take chances.
The short trade is performed using the rounding top pattern. For a short trade setup, the following need to be seen on the charts to complete the setup.
Set the stop loss above the neckline, and set the profit target (Take Profit) at an area where a previous support exists below the neckline.
The chart below showcases a typical setup for a long trade entry using the rounded top.
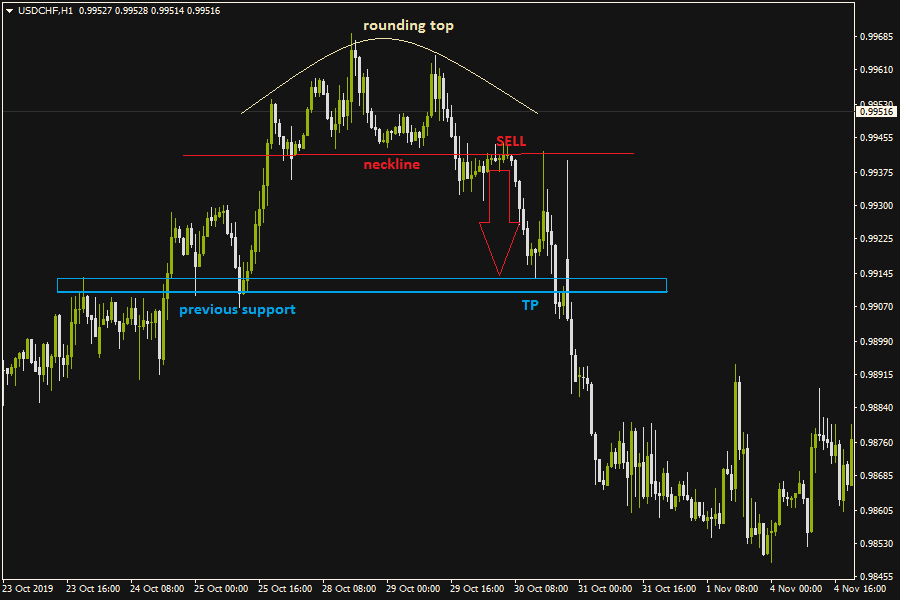
Again, similar principles apply. The neckline was the initial support, but was broken and eventually reversed roles (i.e. became a resistance after serving as a previous support). Just like before, a previous support also served as a pitstop for the price action, which in this example eventually ended up south.
So this is the strategy known as the rounding pattern strategy. It is simple to use, easy to understand and even easier to execute for those who practice it thoroughly.


