
Price channels are formed when two independent trendlines that connect the highs and lows of the price bars or candles, run parallel to each other. Critical to a price channel strategy is the trader’s ability to identify and trace the channels on the charts.
Usually, this involves using a channel tool. Channel tools are found on several trading platforms, as well as on independent charting sites. In order to ensure that a proper trace is achieved, the following rules must be respected in tracing channels.
When completed, a valid, completed channel should look like this:
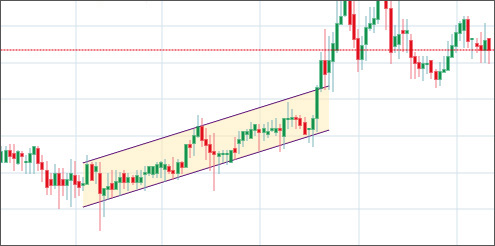
Channels can either be pointing upwards or downwards. Channels which point upwards are ascending channels, while channels pointing downwards are descending channels.
Once the price action breaches any of the trendlines to close outside the borders of the channel, then price will be deemed to have experienced a breakout or a breakdown.
Breakouts refer to upside penetration of a key level of resistance such that the price candle or bar closes above this key level with at least a 3% penetration.
A breakdown refers to a downside penetration of a key level of support, such that the price candle or bar closes below this level with a minimum of 3% penetration.
When it comes to channels, price action has no bias; prices can breakout or breakdown from a channel, no matter where such a channel is pointing.
The aim of the strategy is follow the break of price from either border of the channel. When price has broken a key level, this move opens the door for continued price movement in that direction. This is because a break of a key level signifies strong pressure and market activity on the part of the market players that initiated this move.
In the context of a price channel, the upper channel line is the resistance, and the lower channel is the support. Following a breakout/breakdown, price action on the next candle usually attempts to go back to where it came from. However a phenomenon known in technical analysis as “role reversal” occurs: a broken support becomes a resistance, and a broken resistance becomes a support. We will see the role reversal in action in the chart examples below.
As a rule, downside breaks tend to be more effective and result in stronger moves than the upside breaks. This may be following natural laws, where it takes more force to propel an object away from the earth, and virtually none for an object to be brought down to earth by gravity.
The 1st example shown below is that of a breakdown of price below the ascending channel, followed by a role reversal which saw the pullback in the next candle being rejected at the broken lower channel border, after which the price went all the way down.
A downside break can occur in an ascending channel or a descending channel. Usually if this occurs in a descending channel, it is a sign of increasing weakness in a traded asset. In an ascending channel, this is a sign of trend reversal.
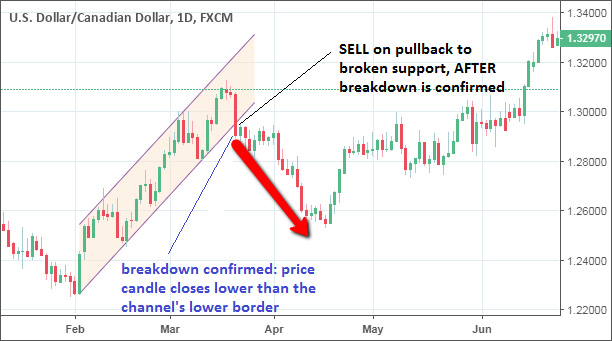
In this daily chart of the USD/CAD, the breakdown candle is shown closing lower than the channel, and the candle which follows attempted to go back higher, trying to re-enter the channel. Role reversal occurred, with the broken lower channel border now acting as a resistance. This marks the area where the trader should perform a trade entry.
So trade is made as follows:
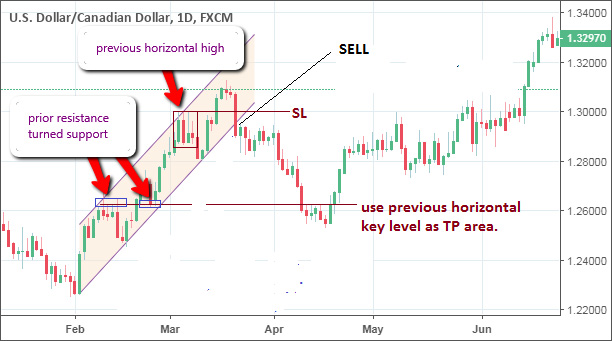
SL and TP points are not to be set randomly. Use previous horizontal key levels as valid areas for setting up these price exit areas. Ensure that you use a risk-reward ratio of 1:3, which means that for every 1 pip set as the SL, you aim for 3 pips in TP.
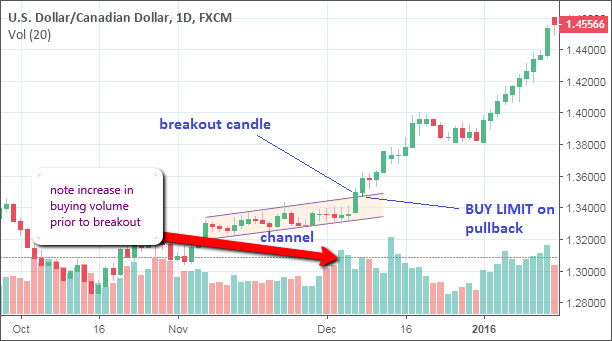
This example shows a situation where the ascending channel is acting as a price consolidation area before a breakout. In this example, the volume patterns are very important. We can see that price was in an uptrend, then began to consolidate in a narrow channel which though pointing upwards, was not very steep.
The increase in buying volume before the breakout from the upper channel border was a clear sign that price was going to shoot up in a breakout fashion. However, the active candle must close above the upper channel border for the breakout to be confirmed. Following the breakout, the price action attempted a pullback into the channel, but was rejected by the upper channel line which is now acting as a support.
Channels face upwards or downwards, and can represent either price consolidation areas (2nd example) or preempt price reversals. Each setup displayed here can also be traded in reverse. In other words, the same setups can occur in the opposite direction, and can be traded accordingly.


