The strategy to be described in today’s article is the MACD histogram strategy, which can be used for exotic currency pairs such as the USDRUB, USDTRY, USDZAR, as well as the various pairings of the major currencies with the Norwegian and Swedish Crowns (NOK and SEK).
The MACD Histogram we shall use today is a customized indicator which has the MACD histogram bars, as well as the fast and slow moving average lines. The MACD Histogram has been coded with an ability to detect divergences as well as moving average cross signals within the indicator, which can then be applied on the charts. These signals are automatically placed by the indicator once the setups have been spotted. Therefore, all you need to do is to place the indicator on the selected currency pairs, and allow it to deliver the signals to you.
The indicator is available as a free download from the MQL5 Community website. You can also just use the download link at the bottom of this page.
The use of exotic currency pairs here is deliberate. They are illiquid pairs which are not usually affected by many of the common news events that get released daily. Furthermore, they tend to have very large moves and so can lead to some bankable moves when using this indicator. So the exotic pairs mentioned could make for some very decent moves if the strategy calls are caught early.
How does the strategy work?
The MACD indicator is an oscillator, but tends to give slow signals which end up being too late to work with when they occur. So the use of a moving average crossover within the MACD indicator could help balance this out. This is why one signal is to use the divergence of the blue line from the price candles. A divergence in this case is as follows:
This is the way the indicator works. Usually the indicator will point an arrow in the trade direction: a green arrow for a long trade and a red arrow for a short trade.
There will also be occasions that the indicator will need two or three tries to get a signal. These are the occasions where you need to filter the signals to ensure you have the right setup going.
Now that the rules are in place, let is look at the trade scenarios.
The short trade setup is as follows:
Here is the chart snapshot showing this setup as well as the application of the various filters in place.
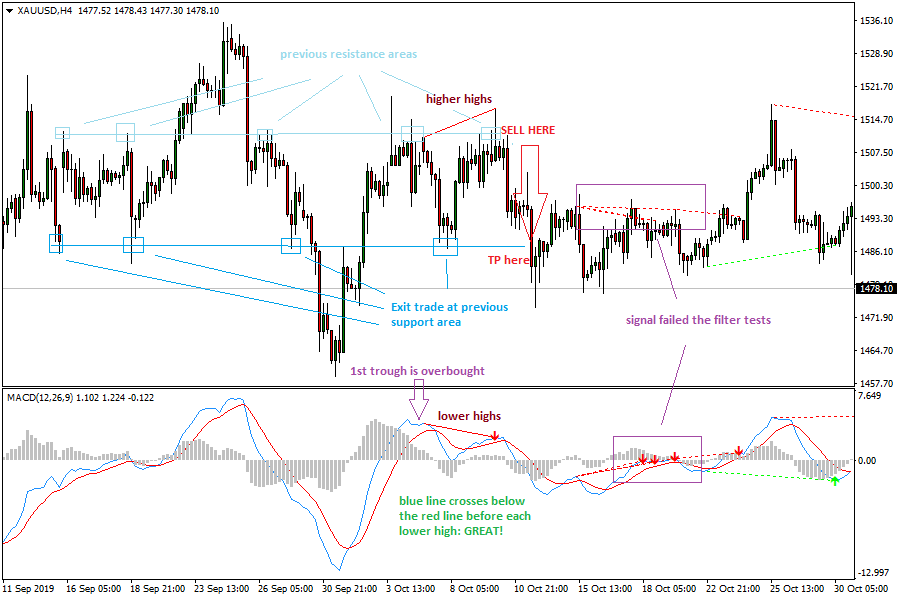
MACD Histogram Divergence: Sell Setup
Here, we can see that the blue line of the MACD histogram crossed the red line of the histogram before each peak occurred. The price was showing higher highs while the lower lows of the indicator was well overbought. Similarly, the price setup occurred at a previous resistance area. We also see that there was a well-defined previous support, which helped secure the Take Profit area.
The presence of a previous resistance on which the Sell entry was anchored, as well as a previous support for the trade exit, provided a good way to gauge the 1:3 risk-reward ratio, providing the needed balance to gauge profitability.
We also see a second setup which did not meet all the filtering criteria, and as we can see from subsequent price action, that setup did not do well.
The long trade setup is as follows:
Here is the chart snapshot showing this setup as well as the application of the various filters in place.
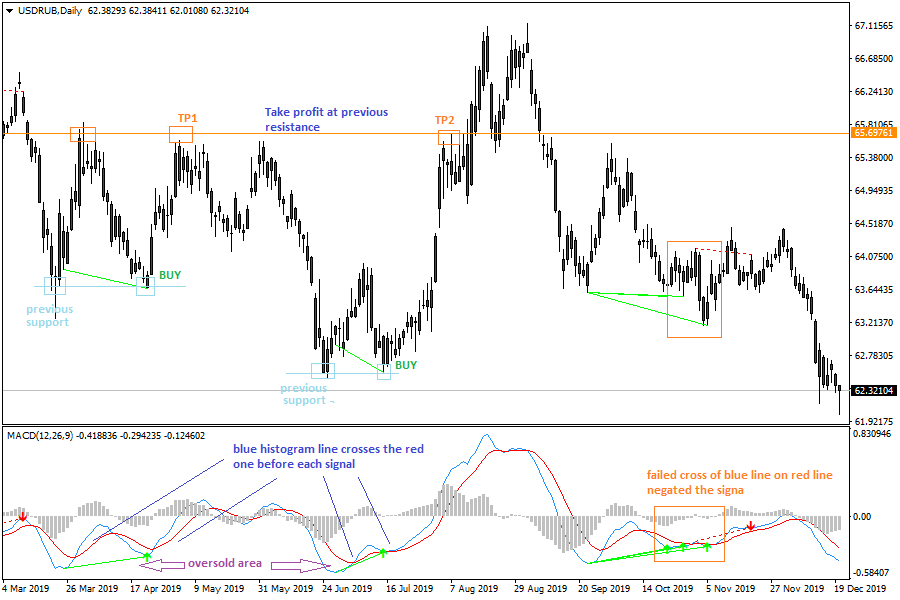
MACD Histogram Divergence Strategy: Buy Setup
Here, we can see two setups that met all the criteria and turned out well, and one that did not meet the filters and which did not end up well. The failed signal showed a situation where the MACD’s blue line failed to complete the second cross in good time, which negated the signal.
The first two worked out well with previous support areas to anchor the long entries. The blue line crossed the red line before each trough and all in oversold areas.
Practice this strategy and learn to identify the filters and use them before any trades are made.
Indicator download link (google drive): MACD Histogram


