
We shall describe the use of the moving average and an oscillator in coining a forex trading strategy. This strategy is devised with a variation of the MACD indicator, as well as two exponential moving averages. This is actually a retracement trade which involves trading the bounce off the shorter moving average and confirming it with a colour change of the MACD indicator.
The tools will involve two exponential moving averages as the trend-seeking indicators, a momentum indicator, and executed on the 4-hour chart.
This system is an example of the moving average cross system, which entails using a shorter moving average and a longer one, in an attempt to filter out the trend signals. Following the cross, the trend for the asset is established. Following the crossover, the moving averages can now function as support or resistance areas on which trades are taken.
The 2-tone MACD indicator is used to provide an early warning signal. It differs from the conventional MACD indicator (which relies on a cross of the zero line) in that the trend change is detected by a change in the colour of the histogram bars and not the cross of the zero line.
Let us see how these indicators are combined to provide tradable signals.
The long trade setup is seen when the shorter moving average crosses above the longer period moving average, with the 2-tone MACD histogram bars changing to a blue colour, and the price then bouncing off the shorter moving average, in that order.
The setup is demonstrated in the example below.
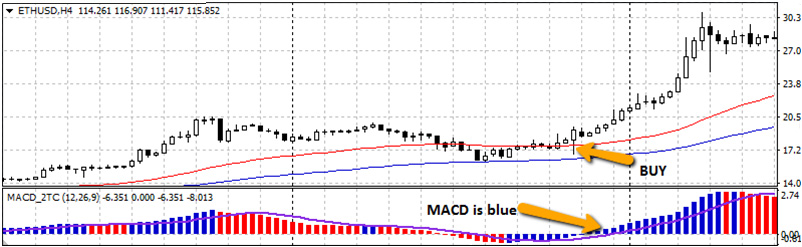
In this chart we can see that the 50EMA has crossed above the 110EMA, and the 2-tone MACD was blue in colour at the area where the BUY stamp is placed. There was yet another point where the price bounced on the 50EMA line, but the MACD histogram at that point was red in colour. Therefore, the trade entry at this point would be invalidated as the parameters did not line up.
The stop loss would be set below the lowest point of price action prior to entry, while the profit target would be the next area where price had previously formed a resistance.
The rules for a short entry are as follows:
The setup is demonstrated in the example below.
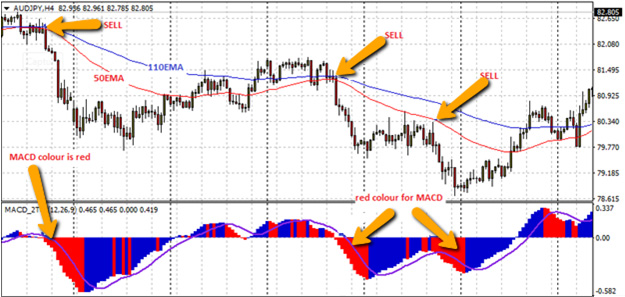
This chart shows several possible entry points. However, there are only three of those points which are valid for a short entry. These are at the areas with the SELL stamp on them. The other areas where the price made contact and was rejected at the 50EMA, but the MACD histogram colour was blue and did not support a trade entry.
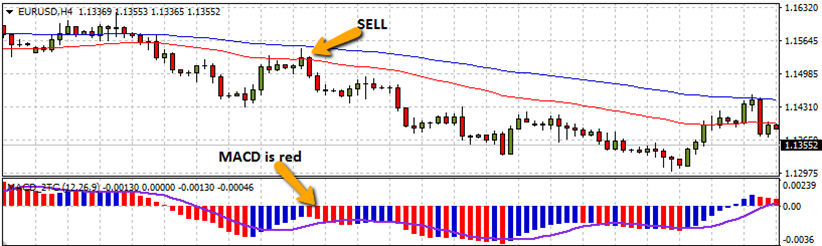
The chart above has been expanded with the zoom tool to show a single sell entry point.
Where do you set the stop loss? The stop loss would be set above the highest point of price action prior to entry, while the profit target would be the next area where price had previously formed a support.
It is important for the trader to note the following points so that errors are not made.


