
The strategy to be discussed today is the price break of the cloud component of the Ichimoku Kinko Hyo indicator. The Ichimoku indicator has 5 components, one of which is the “Kumo” or cloud.
The cloud component of the Ichimoku indicator is bordered by the two lines known as the Senkou Span A and Senkou Span B. The Kumo is regarded as the support/resistance part of the indicator, generally used to trade trend reversals as well as breakouts. The width of the Kumo is a gauge as to the ease or difficulty with which price breaks the Kumo. A wide Kumo will more readily resist or support price action, which will tilt the market towards price reversal. A narrow Kumo will find it more difficult to resist or support price action, favouring a break.
When price is above the Kumo, the trend is regarded to be an uptrend. When price is below the Kumo, the prevalent trend is a downtrend.
In today’s strategy discussion, we will illustrate how to trade a price breakout of the Kumo from downside to upside (long trade setup) and from the upside to the downside (short trade setup).
The strategy follows the typical breakout-pullback-continuation price trajectory that we see with regular breakout sequences on support or resistance trendlines. So the strategy is to trade this sequence in the direction of the breakout, getting confirmation from the volume bars.
Setting of trade exits, whether in the form of protection stops to mitigate losses (Stop Loss), or by use of profit targets (Take Profit), is not a random event. You must use identified parameters to dictate where those stops and targets are set.
For instance, it is customary to use a resistance as a reference point for setting the Take Profit points in a long trade, and to use a support area as a logical reference point for short trades. Furthermore, the Stop Loss should be set below the support in a long trade, and above the resistance in a short trade.
Wait for the price to break the lower border of the Kumo. Allow the next candle to pull back up to the broken lower border if the selling pressure is not significant, or you sell immediately the price breaks the lower border of the Kumo if the selling pressure is high. Usually, the size of the volume bars can provide information as to whether selling volumes are low, high, or are gradually increasing.
Once the break is identified, enter the short order when the price hits the broken lower border. Due to a phenomenon in technical analysis called role reversal, the lower border (originally a support line) is expected to change its function to a resistance. Therefore, the broken lower border is expected to resist attempts by the price to go back to the other side of the Kumo. The trade order can be a market order or a Sell Limit order.
The chart below showcases the downside Kumo break. Focus attention on the green-coloured area: this is the Kumo. The other lines are components of the Ichimoku indicator (tankan and kijun lines and the chikou span): these are not relevant to this strategy and should be ignored.
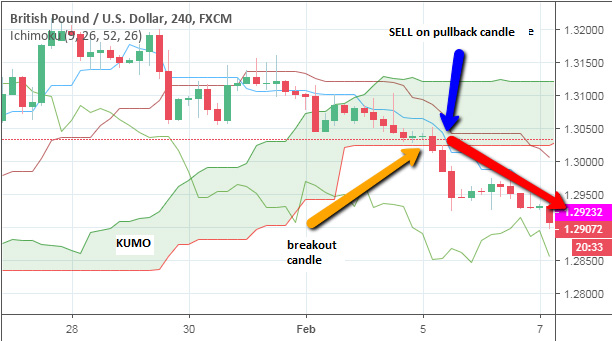
GBP/USD 4-hour Chart Showing Downside Kumo Break
We can see price action breaking below the Kumo, with a pullback on the next candle, followed by more bearishness. It is important to ensure that the breakout candle closes by a factor known as 3% penetration. This means that the distance between the lower border of the Kumo and the closing price of the candle must be at least 3% of the candle’s total length. This is what ensures that price action is strong enough to continue in the breakout direction.
This short trade setup would see the SL set above the upper border of the Kumo. A break of the 9EMA to the upside in a short trade can be used as a signal to exit. You can also use a historical support area to determine your TP target.
The long trade is taken when price has broken out of the upper border of the Kumo. If the breakout is supported by an increase in buying volume, then the signal is reinforced. Of course, there may sometimes be a situation where buying pressure is strong enough to push prices to the point where no pullback occurs. This is the situation found here, where a bullish candle had pushed well into the Kumo, followed by a brief consolidation and finally, the upside breakout.
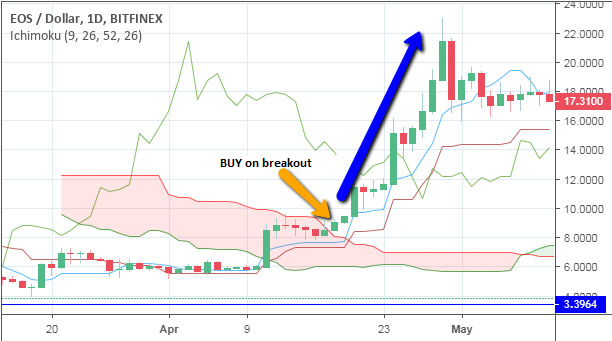
EOS/USD Daily Chart Showing Upside Kumo Break
The long trade setup for the EOS/USD pair actually yielded a lot of profit. As can be seen from the chart, price gained quite a lot on the back of bullish pressure. The order in this case would have to be a market order, as there is no pullback that can be caught by a Sell Limit order.
For the long trade setup, the SL should be set below the lower border of the Kumo. Profit targets should look at historical price action to see where price found support or resistance, and the use of the 9-day exponential EMA can also be deployed. In a long trade, once price has broken below the 9EMA, it is a sign to exit the trade.


