
The iFibonacci short-term trading strategy is designed for you to trade currency pairs on an intraday basis. This strategy makes use of a custom indicator known as the iFibonacci.ex4 indicator, to detect retracement points on the price activity charts, thus enabling a short-term retracement entry along the direction of the detected trend. The iFibonacci.ex4 indicator was created using the Fibonacci numbers, and has the ability to trade several Fibonacci tools such as retracement lines, extension lines, arcs and fans. Of all the tools built into this indicator, we shall use the fan lines component to execute the strategy.
The basis of the strategy is to use the Fibonacci numbers to detect price retracement points on the short-term trend. As described by Charles Dow, there are three types of trends, and each trend type has a major trend, the intermediate trend (secondary trend) and the minor trend. The reason that trends and counter-trends occur is because price action flows and ebbs like the ripples and waves of an ocean. Therefore, price will rise, fall and rise again (uptrend), or fall, rise and fall again (downtrend) in several sequences, allowing for re-entries along the main trend (flows) when the retracements (ebbs) occur.
The major trend is found on the long-term periods such as the monthly chart. The secondary trend showcases activity on the weekly chart. The minor trend is seen on shorter time frames; the 4-hour chart or the 1-hour chart fit the mould here.
When it comes to the chart setup, any time frame can be used to trade the strategy. It is best to use time frames in which there is sufficient volatility to create the number of people that are required to post decent profits. Therefore, it is advocated to utilise time frames such as in 15-minute timeframe, 30-minute time frame, 1-hour time frame and 4-hour time frame.
In terms of indicators, the only indicator that is used for this strategy is the iFibonacci.mq4 indicator. This is a customised indicator that is uploaded to the custom in the data folder of the MT4. To add this indicator to the custom folder, perform the following steps.
This action attaches the indicator to the chart where it will now draw the various retracement lines, fans or arcs around the price action candles.
The strategy aims to trade the retracement move to the Fibonacci retracement tools, with the fan lines forming the primary retracements to be used for this strategy. In some cases, the use of the retracement line can be used to complement the signals generated from the retracement fan lines. What follows is a description of the setup that can be used for long trades and short trades.
A long trade setup occurs when the following occurs:
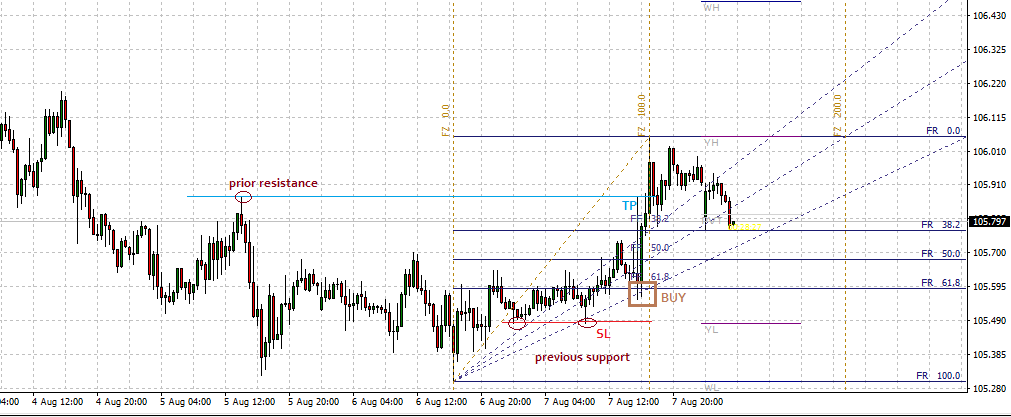
Long Trade Setup
On this chart, we see prices ticking upwards, and the retracement towards the 61.8% Fibonacci fan line. The first candle bounced off that line, followed by the second one which took off to the upside. The entry is made at the open of the candle that follows the bounce candlestick.
Set the Stop Loss (SL) a few pips below the lowest price of the candle that bounced on the fan line or retracement line. Alternatively, you can scroll your charts to the left hand side to detect the price levels where previous support areas are found. Then set your stop loss below this point.
You can set the Take Profit (TP) point using the previous resistance. you need to scroll to the left of the price or scroll your chance to the left to detect a price level where candles found it hard to go above. Then set the TP slightly below this price level.
A short trade setup occurs when the following conditions are seen on the chart:
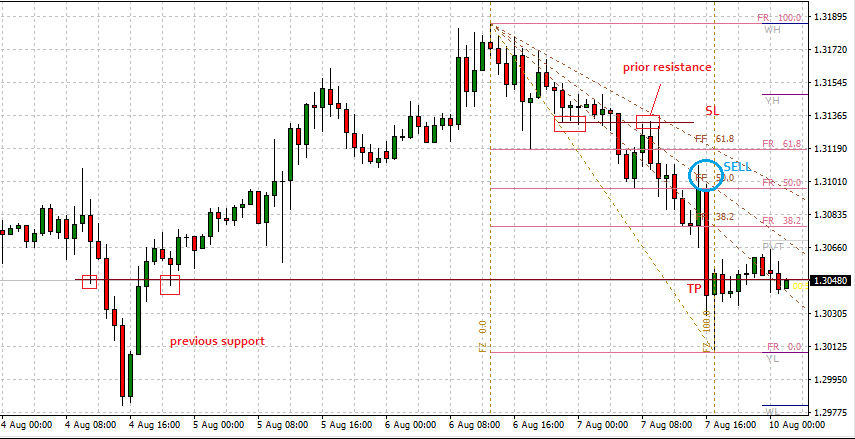
Sell Trade Setup
Looking at the chart setup above, we can see that the price action was in the downward direction and eventually retraced upwards to make contact with the 50.0 Fibonacci fan line. The 50.0 horizontal retracement line also intercepted this area providing a double confirmation of the signal. The SELL candle can be seen being rejected at this price level and headed downwards to form a large bearish candle.
For this example, the Stop Loss (SL) is set a few pips above a price level where the previous candles had met a resistance. This resistance level can also be a former support area that was broken to the upside for role reversal to occur. Alternatively, you can scroll to the left of the chart to see the price candles found resistance. You may then set your stop loss above this point.
You can set the Take Profit (TP) point using a previous support. To do this right, you need to scroll to the left of the chart to look for a price level where a previous support exists. Then set the TP slightly above this price level.
Indicator download link (google drive): iFibonacci


