
This strategy combines a double top or double bottom with an inside day candle formation inside a symmetrical triangle. In actual fact, these three technical patterns have to appear one after the other. The double top/bottom is the first pattern to appear, followed by the symmetrical triangle and finally, the inside day bar.
The order types used for this strategy are the entry stop orders (buy stop for long position and sell stop for the short positions). This is done to prevent premature entries which could ruin the trade.
The strategy is built to work with the daily chart. Therefore, you can expect the position to be open for a few days from start to completion.
There has to be a previous trend, followed by the formation of the double top (in an uptrend) or a double bottom (in a downtrend). When a double top occurs after prices have trended upwards for a while, it is a sign that prices have peaked. Similarly, when a double bottom forms following a downtrend, it is a sign that prices have bottomed.
The next thing would be to wait for price to start reversing against the trend, and enter a period of consolidation (the triangle). The symmetrical triangle is usually a continuation pattern. When price action enters the symmetrical triangle from above, it ends with a bearish continuation. So when price is reversing from the double top, it is expected that it will eventually resolve into a downside continuation.
Similarly, when price is entering the triangle from below, it will end with a bullish continuation. So when price is reversing from a double bottom, it is expected that the price will extend its move upward from the triangle.
After price has entered the triangle, the next step is to use any one of these parameters to get the confirmation for the trade entry:
The short entry setup occurs as follows:
A setup that resembles what has been described above is shown below.
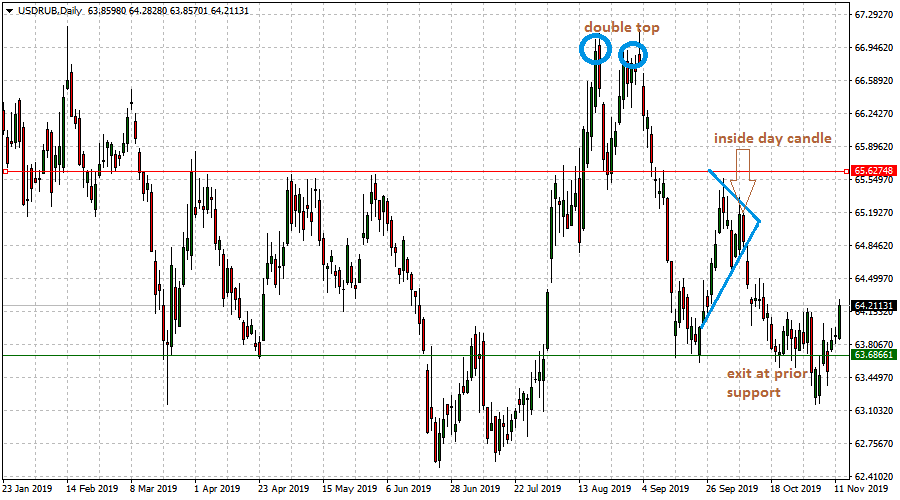
First, we see a double top which signaled the end of the uptrend in the USDRUB daily chart. Price subsequently dipped and went into the triangle. After a brief consolidation within the triangle, an inside day candle formed (see blue arrow), which preceded the downside gap that confirmed the continuation of the downside price action on the pair.
We can also see that the 63.6272 price level was a previous support on at least three occasions. This is why that price level would have been a good place to exit the trade. A trade like this would have made some good money with a sound risk-reward ratio.
For a long entry setup, the following need to be seen on the charts to complete the setup:
The chart below showcases a typical setup for a long trade entry.
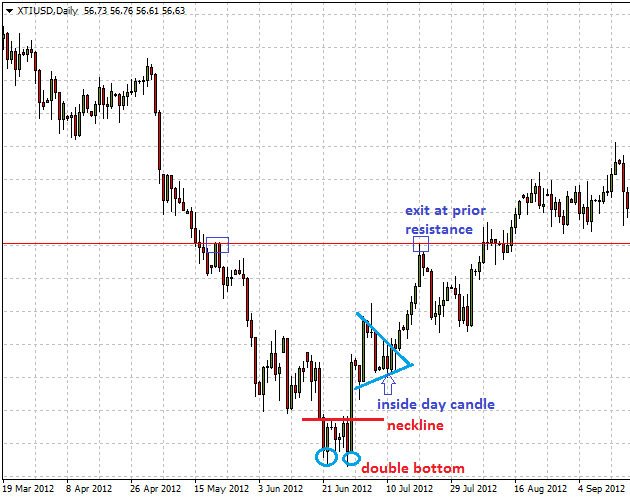
Here, we can see that the double bottom ended the downtrend. Price broke the neckline to confirm the double bottom, after which it entered a period of consolidation which formed the symmetrical triangle. The inside day candle signified that it was time to prepare for a breakout, which eventually occurred.
The exit point of the trade should be a near-term previous resistance. We can see that the resistance formed on the 6th of May 2012 provided this price level which was eventually obeyed by the price action on July 19, 2012. Therefore, when setting up the trade, a previous resistance should be deployed as the Take Profit area.
The takeaways from this strategy are as follows:
This trade setup requires patience as it takes several weeks to setup and may also take some weeks to resolve fully from trade entry to exit.


