
The Fibonacci tools are very effective forex trading tools and can be used to trade a variety of market scenarios with a high degree of accuracy. They are based on the Fibonacci numbers, which are a sequence of numbers in which each number (known as the Fibonacci number) is derived from adding the preceding two numbers.
The Fibonacci retracement tool is perhaps the most popular of the Fibonacci tools which are derived from these number sequences. For instance, the 61.8% Fibonacci level (0.618) is derived by adding the 23.6% (0.236) and 38.2% (0.382) numbers.
These number sequences are used to derive tools which can predict the maximum points of possible price retracement in the context of a trend.
The charts to be used for the strategy should be pulled from the MT4 or MT5 platform. This is because the indicator used here was coded on the MQL interface.
The indicator is a custom indicator which can be downloaded online or from the MQL Community marketplace. The indicator is made up of a combination of various Fibonacci tools:
For this strategy, we will focus on using the Fan component of the tool to take intraday trades.
The strategy here is to detect possible areas of retracements and trade the continuation of the short term trend. The advantage of using this indicator is that it automatically picks the swing highs and swing lows when loaded to the chart, thus eliminating the possible errors that could occur during the manual tracing of these reference points.
The indicator automatically displays all the Fibonacci levels (retracement lines, fan lines, etc.) on the chart. For this strategy, we will focus on the fan lines. These lines usually span out in a diagonal fashion from the reference points.
To be able to take a short trade, prices must be trending downwards initially, followed by an upside retracement (green arrow). The short entry is made in the following manner:
The chart below shows what a short trade entry setup looks like. In this case, the rejected candle did not close above the 38.2% fan line, even though it breached it. This goes to show the importance of actually allowing the candle to close so that the relationship between the closing price and the fan line in focus can be established.
The entry price area also corresponded to a price level where price had previously found support and was broken (i.e. a support-turned resistance). A broken support will perform what is known in technical analysis as a role reversal, which causes it to perform as a new resistance.
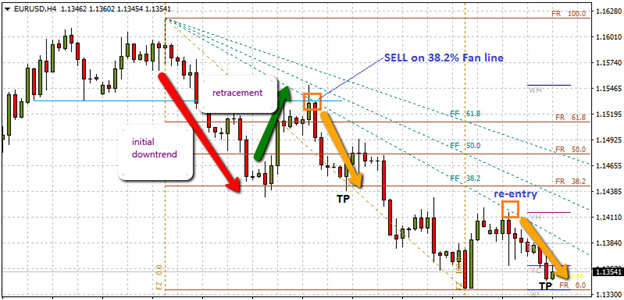
Short trade setup
There was also an opportunity for a re-entry. Re-entries are possible if the trend-retracement-trend price pattern on the chart continues for some time.
To take a long trade, prices must be trending upwards initially, followed by pullback to the downside (red arrow). The long entry is made as follows:
The chart below shows a long trade entry setup, with price finding support twice at the 38.2% fan line. We can see that the first pullback candle actually went all the way down to the 50% fan line, but eventually closed at the 38.2% fan line. The candle following it had a much smaller body, indicating that selling pressure had dwindled and was ripe for the large-scale buying that took place thereafter.
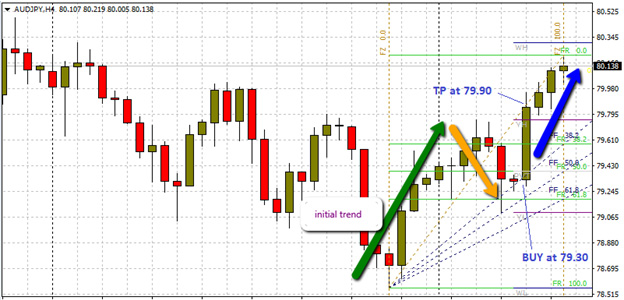
Long trade setup
There was no opportunity for a re-entry in this case, but the trade would still have yielded up to 60 pips in profit had it been taken at the correct point. It must be pointed out that price moves on long trades tend to be smaller than those of short trades. Therefore, traders should ideally not target re-entry trades in the long trade setup. Such opportunities are more easily found in short trade setups.
Some important lessons can be learned from this strategy. One of such lessons is that it is not enough to leave all the work to the indicator. Some application of trading sense should be brought to bear on the trader’s part. Do not enter trades blindly. Always do a historical check to see if the trade entry point corresponds to an area of previous support or resistance. Pullback candles should be allowed to close before trade entry decisions are made.
It also helps the trader to check what the buying and selling volumes are at any given point in time. Volume information is invaluable when setting up entries.


