
News trading is part and parcel of trading forex. The forex news calendar (also known as Economic News Calendar) is a schedule of events and economic indicators, whose results or figures indicate how strong or weak the economies of the major currencies are. The calendar also features occasional political events. Together, these events create a market bias for the currency pairs involved, and traders will either buy or sell the currency pairs according to the outcomes of the news events.
Traders tend to study the new numbers to interpret what impact these will have on the economy of the currency in focus. This causes them to form a bias (also known as sentiment). Bias or sentiment around a currency from the news numbers can be around for a long time, which is why the news is said to move the markets.
You need the following to trade the news:
The economic calendar shows the dates and times that each news will be released in advance, allowing you to prepare for those times adequately.
A news trade has three phases. You must therefore know what to do and how to trade these phases. Critical to understanding these phases is a knowledge of how the numbers are interpreted.
Every news trade strategy depends on these three numbers:
Before any news trade, analysts and economists are polled to determine what they think the numbers would be. The number arrived from this poll is called the consensus number or the forecast.
The past number is usually the previous actual figures that were released for the economic news event. This figure is important because it is used to derive the tradable deviation: the difference between the consensus and the previous number.
The actual number is the figure that is released to the markets for the current news event. This number is compared to the consensus to see if it is higher or lower than the consensus. An actual number is only tradable if it exceeds or falls short of the consensus, and if the difference between it and the consensus exceeds the tradable deviation (difference between consensus and previous number). Large deviations mean that the volatility on the chart and size of the initial spike will be large. Smaller deviations mean smaller price changes.
The three phases in a news trade are as follows:
The first phase is the immediate period following the news release and usually lasts from a few seconds to about 2-3 minutes. If the numbers meet the benchmarks for a trade, there is an initial spike (caused by the entrance of institutional investors who trade in billions of dollars). The institutional investors receive the news a few milliseconds before everyone else, and have automated algorithms that can enter positions into the market very fast, causing the initial spike.
Once prices have been pushed to a certain extent, Phase 2 kicks in. This phase is marked by intense retracement of price as the institutional investors start to take profit. You will recognize this phase by price beginning to stall on the charts, with some whipsaws and choppiness. Do not attempt to enter the trade when this starts to happen, because prices will start to retrace almost soon after. The degree of retracement can be measured with the Fibonacci retracement tool on a short-term chart such as the 5-minute or 15-minute chart.
This period occurs because the massive volumes of trades from the institutional trade positions overwhelm the late entries of everyone else, and the markets will follow these orders. This phase lasts from 5 minutes to 1 hour.
The third phase commences when prices start to move in the direction of the initial spike, but in a slower fashion. By this time, the markets have digested the news trades properly and other considerations have started to come in. Prices may be deemed cheap enough for further re-entry by the institutional traders. This phase typically starts from 1-3 hours and may last for days.
As a retail trader, you really cannot compete with the institutional traders in trying to get in on the initial spike. So your best bet is a retracement entry that follows the direction of the news trade.
► Step 1: Allow the initial spike to occur. This gives you time to analyse the news numbers.
► Step 2: Switch to the short-term charts and apply the Fibonacci retracement tool to the chart. Also take note of any short term support or resistance areas that align with a retracement level as they may become relevant to setting up a re-entry.
► Step 3: Add the Stochastics tool to the chart and reset the parameters to 5,3,2.
► Step 4: Where the Stochastics indicator crosses in oversold territory while an upward spike has retraced to a Fibo retracement level is where you setup a long trade re-entry, in order to follow a news trade which points to an uptick in price (long trade). Do the same for a short trade re-entry (Stochastics cross in overbought territory) where the news supports downside to the currency pair.
The following is a description of how to take a short with a news trade. In this instance, the news trade was a negative one with a deviation which was large enough to cause an initial downward spike. Do not trade the spike. Rather, examine the numbers and setup the indicators as earlier described.
1) Watch the direction of the downward spike. Allow retracement to start occurring, then trace the Fibonacci retracement tool from the open to the low of the spike candle on a 5-minute chart.
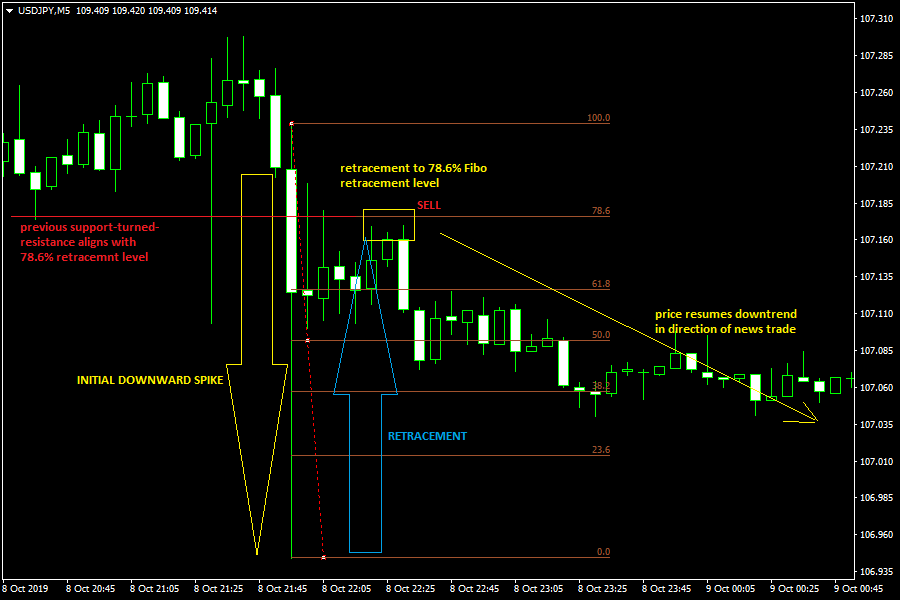
News Trade Showing Short Trade Setup
2)Most news retracements tend to retrace to the 50%, 61.8% and 78.6% Fibonacci retracement levels. Keep an eye on these areas. For a short trade, the retracement usually ends at a Fibonacci level that corresponds to a previous support-turned resistance, as we see from this example.
3) Place the SELL after two or three candles have formed at that retracement area, and follow the original trade direction for a few hours.
4) Switch back to a higher chart (e.g. 1 hour or 4-hour chart), then place your stop loss above the spike candle, and the Take Profit at a previous support that gives a 1:3 risk-reward ratio at the barest minimum.
Here’s how to perform a long trade.
1) Watch the direction of the spike in the news trade. Usually, the actual number should be better than the consensus number. This should lead to an upward spike if the deviation is large enough for such a trade.
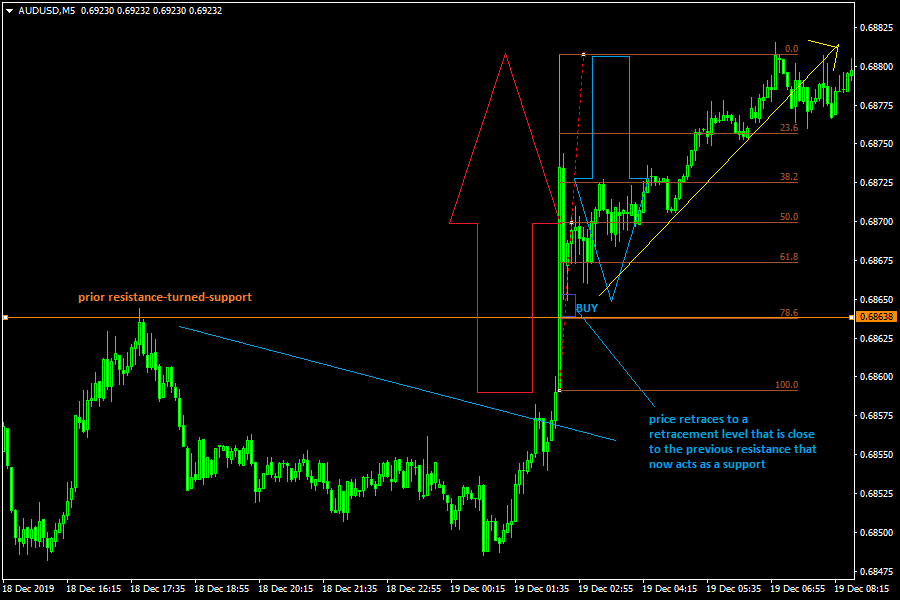
Long Trade Setup on a News Trade
2) Switch to the 5-minute or 15-minute chart. When the price starts to retrace on the charts, apply the Fibonacci retracement tool from the open price of the spike candle to the highest price on that candle. This draws the retracement levels.
3) Again, retracements tend to occur more to the 50%, 61.8% and 78.6% retracement levels. Watch to see which of these levels matches a previous resistance. That resistance will reverse roles to function as a support.
4) Place a BUY trade on the retracement level that is close to the previous resistance-turned-support.
5) Set the stop loss below the spike candle, and set the Take Profit using a previous resistance that is close to the spike candle high or above it.


