
Here is another day trading strategy which utilizes pivot points. The strategy is good for day traders and is designed to keep them on the right side of the market. By now, you must have seen from some of our earlier strategies that any attempt to deploy any strategy at all that leaves you on the opposite side of the banks puts you in great jeopardy. The banks control the market, which is why any strategy described here aims to stay on the side of the banks, and helps you ride out whatever profits you can from following their moves.
The indicators to be used for this strategy are:
Let us now see how this strategy works.
How does the strategy work?
The aim of the strategy is to buy or sell the currency pairs at the central pivot points. This is the first rule of the strategy. We aim to buy at the central pivot in an uptrend, and to sell the currency pair at the central pivot in the downtrend. This is because the central pivot represents the point of balance between the buyers and sellers on any given trading day. Therefore, by using the central pivot as the entry price for all trades, we already have price entry and exit points. We would then need to use the accumulation-distribution indicator to filter the trades.
The positional relationship between the price and the central pivot point determines the outlook for that day.
If the price is above the central pivot, then the outlook for the day is bullish, in which case a buy order at the central pivot point will target the R1 pivot as the initial price target, and R2 will be the next price target if the market continues to push upwards.
In the same vein, if the price is below the central pivot point, then the outlook for the market is bearish. In this case, a sell order placed at the central pivot will target the S1 pivot as the initial price target, and the S2 pivot if the price continues on downward trajectory.
You will need to enter into the trades only in the direction of the main trend. This is where you’re A/D indicator comes in. You will also need to use the 200-period EMA and the A/D line in a crossover pattern to show you the direction of the trend. A longer term moving average is more reliable in this instance.
The signal to use is the cross of the A/D line above or below the 200EMA, at the same time that the price is close to the central pivot point, provided the price is on the correct side of the pivot point. The aim of the trade is therefore to buy the currency pair when the A/D line has crossed the 200 EMA and is above it, or to sell the currency pair when the A/D line has crossed the 200 EMA to the downside and is below it.
Now that the rules are in place, let is look at the trade scenarios.
The long trade setup is as follows:
Here is the chart snapshot showing this setup.
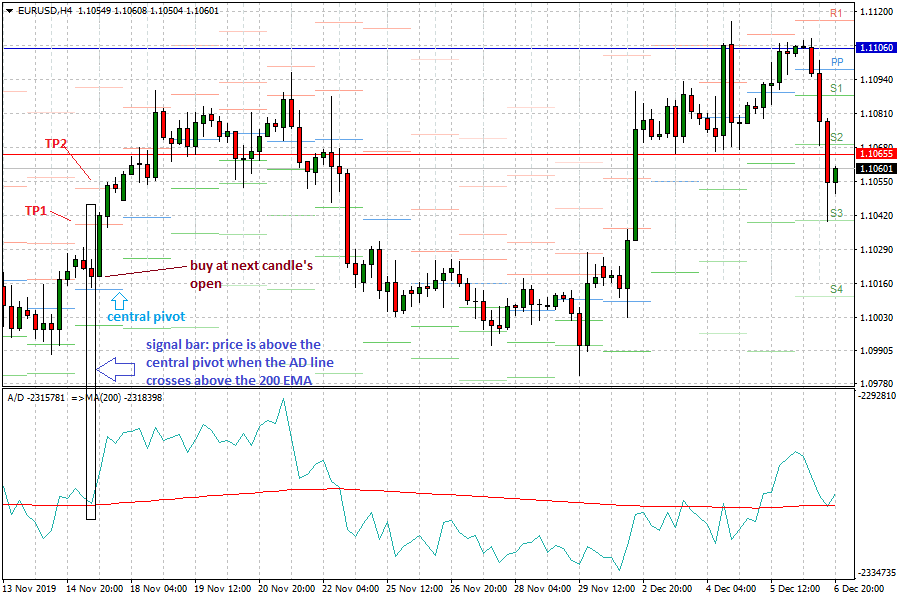
Pivot point strategy with A/D line: Buy Setup
Here, we can see that at the time that the A/D line crossed above the 200 EMA line, the price candle was above the central pivot. Therefore, the BUY trade is taken at the open of the next candle, as this is very close to the central pivot point. The TP1 and TP2 lines correspond to the R1 and R2 pivot points, which serve as the 1st and 2nd Take Profit areas.
The short trade setup is as follows:
Here is the chart snapshot showing this setup.
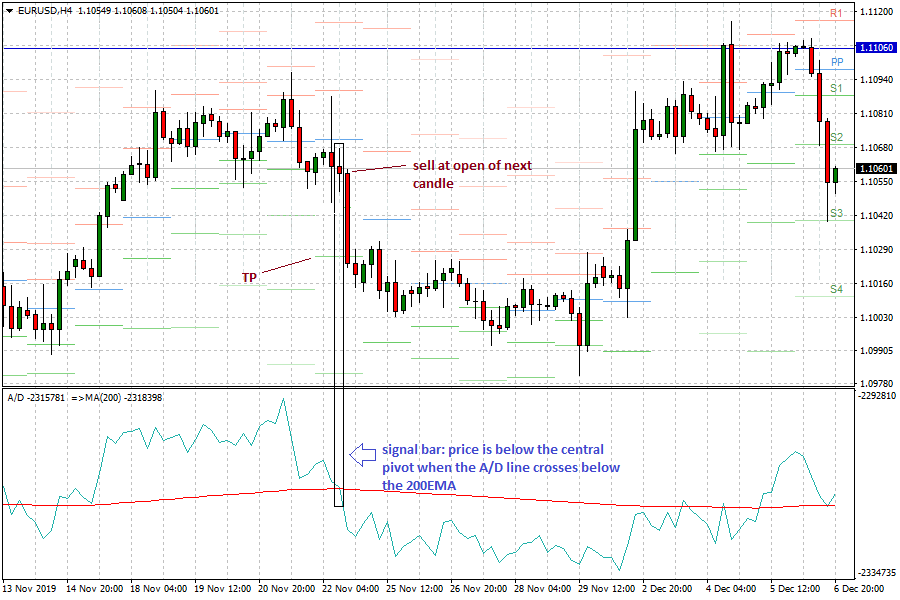
Pivot point strategy with A/D line: Sell Setup
Here again, we can see that at the time the A/D line crossed below the 200EMA line, the price candle was below the central pivot line. Therefore, the trade was opened at the opening price of the next candle, with the Take Profit set at the S1 support pivot.
This strategy typically delivers 20-30 pips at a time, which is an achievable daily target considering the number of currency pairs listed on a forex platform at any given time. Practice this strategy and perfect your understanding of the setup so you can start using it to profit immediately.


