
This strategy is aimed at showing traders how to trade a divergence setup within a price channel. A price channel usually faces upwards or downwards, and is made up of two parallel lines which independently connect the peaks and troughs of price action. In other words, the upper line connects the price highs, and the lower line connects the price lows.
The parallel lines that make up the channel are:
For channel lines to be valid, they have to connect at least three price highs and three price lows. Connecting two highs or lows simply means that there is potential for a valid channel to be formed. When these lines are touched by a high and a low for the third time on both occasions, the channel borders are confirmed.
With highs and lows connected by these lines that form the channels, it is easy to spot when prices are forming lower highs and higher lows, which are the basis of detecting price divergence when combined with lines touching similar spots on an oscillator signal line. Oscillators that can be used for divergence trading include the Stochastics oscillator, Relative Strength Index (RSI), Commodity Channel Index (CCI) and the DeMarker indicator. The Momentum indicator is also good for trading divergences, but the use of this indicator is not as straightforward in this function because it does not have a defined upper and lower range that remains static with time.
For this strategy, we will use both the RSI and the DeMarker indicators as our reference oscillators.
This is essentially a reversal pattern. Part of the success of this pattern lies in the identification of a formation on the oscillator’s signal line which is known as the “failure swing”. The failure swing on the indicator window is a setup that tells the trader that the oscillator’s signal line has lost momentum in the prevailing direction and will signal a divergence.
Oscillators are primarily known as indicators that can detect overbought and oversold market areas. This is seen as periods when the indicator’s signal line remains in the zones marked as overbought or oversold in the indicator window. Appearance of the failure swing setup on the indicator window is important because it is possible for the indicator’s signal line to stay in the overbought or oversold areas for a considerable length of time, within which price action will continue to do its thing. In these instances, relying on the overbought/oversold signals may produce incorrect signals for the trader. But the failure swing has been shown to have a high degree of accuracy.
The best results are seen when this setup is used on the 4-hour and daily time frames.
Identification of the “failure swing” setup in the oscillator window is key to the success of this strategy. A failure swing setup is seen when the oscillator’s signal line shows the following:
So how does this pattern look like? Here is a glimpse of what a failure swing on the oscillator window looks like. The peaks and troughs in a failure swing can be connected with a line traced from the line tool to give a clearer picture.
The snapshots above reveal some important points:
The long trade setup occurs when price has touched the lower trendline of the falling channel at two points so as to form progressively lower lows. At the same time, the oscillator line should form a failure swing at the oversold area in the indicator window. This setup is shown below.
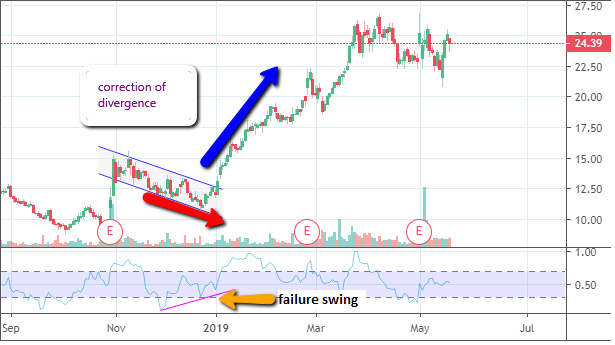
The signal to go long would be a bullish reversal candlestick formation at the lower trendline of the channel, or even the break of price above the channel’s upper border (i.e. the return line).
The Take Profit (TP) target should be set at the next horizontal resistance level. Furthermore, it is also possible to set the profit target using the oscillator line. In this case, you would expect to allow the indicator line cross the midpoint and into the overbought area before exiting the trade.
The short trade setup would occur when the price action has touched two areas on the upper border of a rising channel in such a manner that they form progressively higher highs. At the same time, the oscillator line should form two progressively lower highs at the overbought region of the indicator window, thus forming the failure swing pattern.
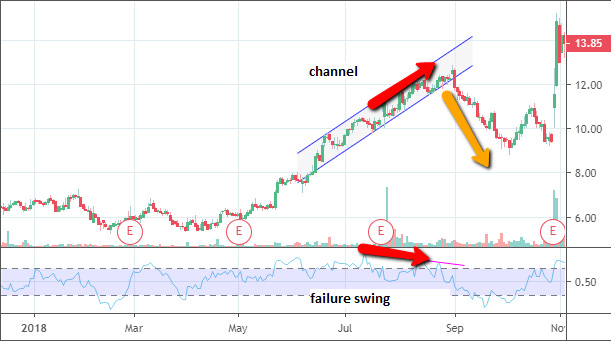
Here we can see the blue arrow on the lower trendline of the channel being used to demarcate areas of price action where price had touched the channel border several times, coinciding with the formation of a failure swing at the overbought region of the RSI indicator window. Again, the entry signal would be a bearish reversal candlestick pattern on the channel’s upper border, or a break of the lower border of the channel.
The Take Profit target is set at an area where there is horizontal support below the price border. Also, you may use the oscillator’s signal line as the trigger to exit, when this line enters the oversold price area.


