The strategy to be described today is the Bollinger band swing trading system. The system was designed for use on the daily charts. However, it can be used on lower time frames, provided that the candles have enough liquidity for the price-formation mechanisms to work properly.
The indicators to be used for this strategy are:
Let us now see how this strategy works.
How does the strategy work?
When run as an oscillator, the Intraday Intensity indicator works as a divergence indicator as well as an overbought/oversold indicator, in which the most overbought market value is +1 and the most oversold market value is -1. The midpoint is 0. Therefore, you tend to see positive values that are above 0 and up to +1 when there is a bullish market, and you will see negative values that are below 0 and -1 when sellers are dominating the market.
The divergence trade setups are fewer to find, but more accurate.
What this means is that you will look to sell the currency pairs when the price action candles have touched off the upper Bollinger band, at the time that the Intraday Intensity indicator is showing a divergence signal.
In the same vein, you look for a bounce of price action candles on the lower Bollinger band when the Intraday Intensity indicator is oversold, to produce a buy reversal signal.
In both instances, the presence of reversal candle signals at both ends of the Bollinger bands usually strengthens the signals and reduces the fake signals and error rates that could lead to trade failure. The following candlestick reversal patterns include:
Now that the rules are in place, let is look at the trade scenarios.
The long trade setup is as follows:
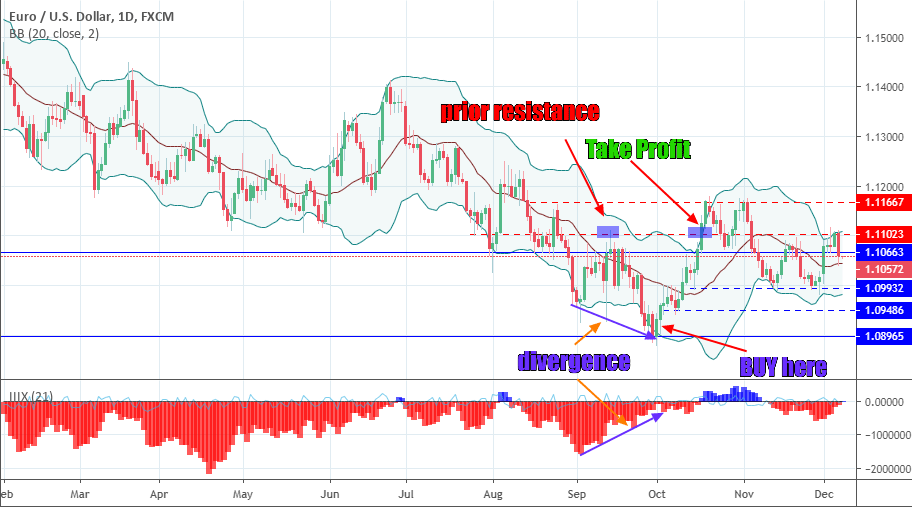
Here is the chart snapshot showing this setup.

Bollinger swing strategy: Buy Setup
Here, we can see that there was a divergence area where price was showing lower lows at the same time that the Intraday Intensity indicator was showing higher lows. The reversal candlestick pattern on the lower band was a piercing pattern. The buy trade triggered on the daily chart made it to the upper Bollinger and stalled at 1.1023. This price is where price had earlier found resistance, making it a good place to exit the trade.
The short trade setup is as follows:
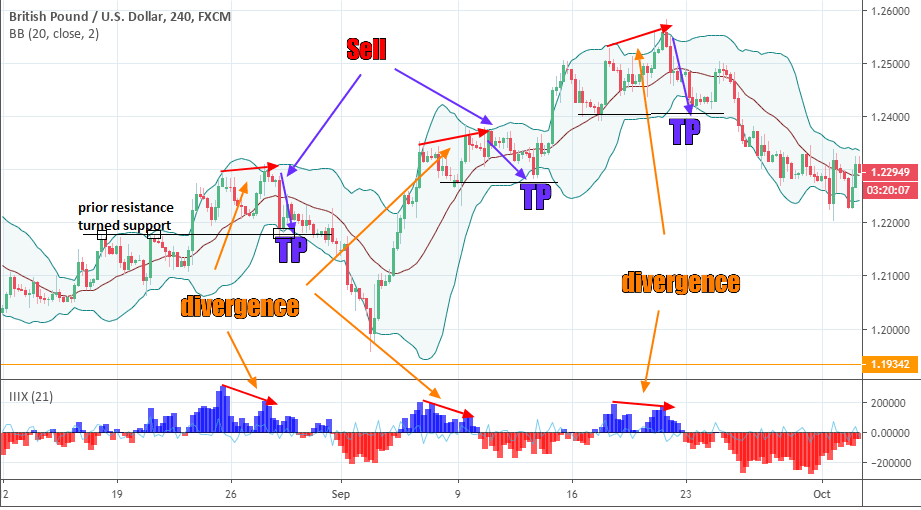
Here is the chart snapshot showing this setup.

Bollinger swing strategy: Sell Setup
This is a 4-hour chart, which shows three trade setups over the course of several days. The candlestick reversal patterns were an inside day candle (twice) and a dark cloud cover. In each of these cases, price action was able to touch off the lower Bollinger band, which in all cases, marked points of previous resistance turned support (1st entry) or prior support areas.
This strategy typically delivers 10-30 pips at a time, which is an achievable daily target considering the number of currency pairs listed on a forex platform at any given time. Practice this strategy and perfect your understanding of the setup so you can start using it to profit immediately.
The Intraday Intensity indicator can be found on Tradingview charts and used there with the Bollinger bands.