This strategy shows how to trade a short-term or mid-term market reversal using price action that is based on the Fibonacci numbers. This strategy is known as the 1-2-3 reversal pattern. Being a reversal pattern, it can occur at the top or bottom of a price move in the short-term or mid-term. The basis of the 1-2-3 reversal pattern is to identify a point of price weakness which manifests as what is known as the “failure swing”. A failure swing occurs when a re-emergent price move fails to make the previous price of the initial move in the same direction. This strategy will therefore show how to identify the failure swing when it occurs as well as the use of the Fibonacci numbers/ratios to confirm the relevant price moves when they occur. This strategy will be traded on the 4-hour and daily time frames.
The hallmark of this strategy is the identification of the “failure swing” price action as part of the 1-2-3 price move. The 1-2-3 price move derives its name from the price wave patterns and consists of:
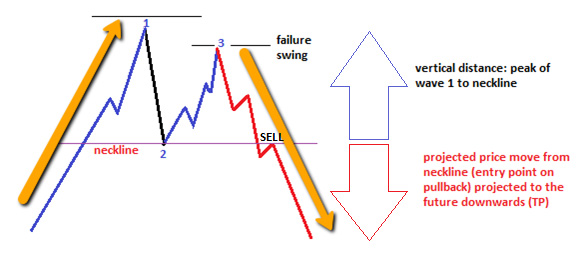
Short trade setup
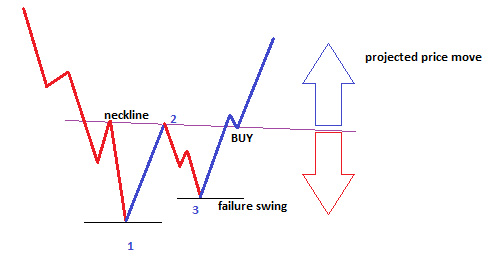
Long trade setup
It can be seen that none of the price waves are actually straight line waves, but the wave patterns tend to look like the 3-wave and 5-wave subdivisions of the main wave patterns as described by the Elliot wave principles.
Here are some important points to note about the 1-2-3 reversal patterns.
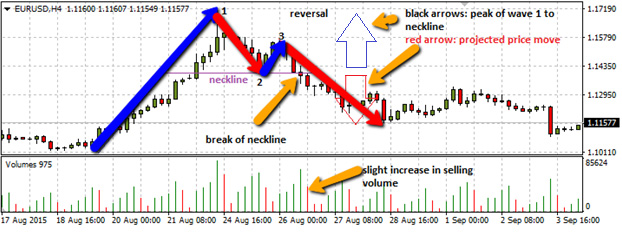
The snapshot below demonstrates the short trade setup. First there is an initial uptrend move, which terminates at a peak. This wave is known as wave 1 (long blue arrow).
Next is a downside retracement, which terminates at a certain distance that must be a Fibonacci ratio of the wave 1. The trough of this wave is the termination of wave 2. Now let us calculate this to know if it conforms to the Fibonacci ratios described earlier. The price move that constitutes wave 1 starts at the 1.1011 price area and ends at 1.1601, a distance of 590 pips. Wave 2 extends from 1.1601 to 1.1396, a distance of 205 pips. What is the ratio of 205 pips to 590 pips? The ratio is (205/590) X 100% = 34.74%. This is very close to 1/3 retracement and also close to the 38.2% retracement level. So the price move of wave 2 closely conforms to Fibonacci ratio of 38.2% and also the retracement level of 1/3.
Wave 3 (the failure swing) ended at 1.1555. This is a distance of 159 pips. Compared to wave 2, this is a 77.6% move, which is close to the 78.6% Fibonacci ratio.
Once price has started to reverse at the end of the 3rd wave, you should wait for a break of the neckline. In this case, the breakout candle closed below the neckline, with a brief pullback up to the broken neckline when the next candle opened. At this time, the neckline which used to be a support level, performed a role reversal to become a resistance. Price reversed down all the way from there.
Note the slight increase in sell volume. Also note that the projected price move was almost exactly the same height as that of the vertical distance from wave 1’s peak to the neckline.
So for a short trade, initiate a Sell Limit order, using the neckline price as the entry price. Set the stop loss above the neckline, and the TP should be set using the height from peak of wave 1 to the neckline.
The long trade follows the same principles, but results in an upward reversal and break of the neckline to the north. In the long trade setup, volume confirmation is an integral part of the strategy and must be sought for before initiating any orders that follow price to the upside.
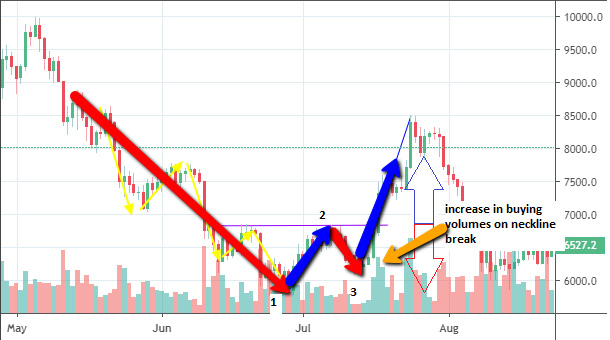
The chart shows the initial price wave 1, which is actually a major impulse wave with 5 smaller waves (yellow arrows). We can also see how price evolved into wave 2, the failure swing at wave 3 and the upside reversal which was accompanied by a marked increase in buying volume. Also note the projected price move to the upside, where the price move from the neckline slightly surpassed the vertical distance from the trough of wave 1 to the neckline.
The long trade would therefore be a Buy Limit at the neckline price (if there is a pullback to the broken neckline) or a Buy order at the open of the next candle following the breakout. The TP should be set at a price that conforms to the distance from the trough of wave 1 to the neckline, projected upwards from the neckline break point.
This is how to trade the 1-2-3 reversal setup.


