
Retracement trading is the technique of catching entries that follow the pre-existing trend when there has been a correction. The challenge for most traders is distinguishing between a trend reversal and a correction. This article will help a lot of you who follow this site, especially if you are one of those caught out by the recent drop in cryptocurrency prices. By the way, what we saw between May 17 and May 23 2021 was a mere correction and not a reversal. Some savvy traders made a lot of money from it, but the majority did not. Understanding this concept makes you one of the savvy traders.
A retracement is also known as a countertrend move. It is a price move of an asset (currency pair, stock, index, etc.) that goes against the trend. This move can be a dip in an uptrend, or a rally in a downtrend. This is a price move which occurs as a result of profit-taking from traders who entered the trend much earlier than most, or may simply be an action of accumulation or distribution from the high-volume firms i.e. the institutional traders.
Retracements are a normal part of price movements and must not be mistaken for a reversal. A retracement does not usually exceed 100% of the initial move. More often than not, the retracing may be up to 50% of the way or may be as much as 2/3rds of the initial trend move. Sometimes, the retracement can be a full retracement, depending on the reference price at which the trend started. A reversal in most cases does not just stop at 100% of the move, but continues in the opposite direction for much longer. Once this occurs, you are no longer dealing with a retracement, but a price reversal.
The reason for retracement trading dates back to the nearly 100-year old concepts postulated by Charles Dow, which now form what is known as the Dow Theory. To put it simply, price never moves in a straight line, but ebbs and flows like the waves of an ocean.
Simply put, price will never go up in a straight line. If you expect the EURUSD to make a 100-pip move, you will most likely not get price shooting up like a rocket. Rather, it will make various up-down movements over time to achieve the price objective.
No trader can boast of being able to absolutely catch the perfect top or bottom. So savvy traders aim to see if they can pick the points of maximum retracement so as to re-enter trades in the trend direction, especially if they missed the early train.
It is also possible to catch a move early, offload the position in profit, and make a retracement entry to catch more profits from what can be considered as safe positions for such entries.
Two types of retracement trades are recognized. These are:
Price retracements tend to be quite predictable. Results can be achieved with a great degree of regularity when using percentages as the tool for detecting entry points on a price retracement. Percentages are easy to use and can be deployed by even the least experienced of traders. If you can spot the commencement point of a trend, and you can spot the top (uptrend) or the bottom (downtrend), then you can use this method. Personal experience has shown that most percentage-based retracements tend to cluster around the 50% levels (i.e. the halfway point), the 33% (one-third) point or the 67% (two-thirds) point. Collectively, these are known as retracement percentages.
Each of these retracement percentages carry a failure risk, as they are not fool-proof. The lowest risk comes with the 67% price level, while the highest risk comes with the 33% percentage. By risk, we mean the chance that price will continue to retrace even when you have entered a position to get into the original trend. When this occurs, the trade will enter a drawdown. By implication, you get lower drawdowns with the 67% retracement point than you will get with the 33% level.
Measurement of the percentage points is simple.
A) A rough and quick way to do it us to apply grid lines to your chart, measure the number of grid lines from the start of the trend move to the point at which the price started to retrace. Count the grid lines in a vertical sequence, then derive the percentages. For instance, if you count 4 grid lines, your 50% point will be at the junction of the 2nd and 3rd gridline.
B) Some traders opt to use grid lines on the chart in carrying out their retracement measurements. However, a more exact method of performing the measurements would be to measure the pip moves directly from the swings of price movement. In other words, you would take a vertical measurement from the price at which the trend commences, to the price level at the initial top or bottom of the trend (i.e. where the retracement starts). Then you would get the value of 33%, 50% and 67% of this move.
Look at the snapshot here. There are 7 and a half grid boxes between the price low and price top. The price retraced by 4 grid boxes in height, giving a retracement percentage of 53%. If you had entered at the 50% retracement point, you would have had a small drawdown relative to the position and been able to have the trade turn in your favour.
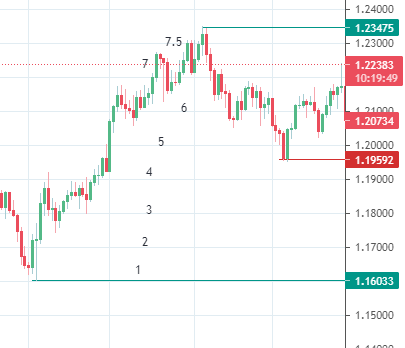
Use of Grid Box Method to Calculate Percentage Retracement Levels
Percentage retracements still require other confirmations such as use of a previous resistance or support, and use of candlestick patterns to improve the accuracy.
The use of Fibonacci numbers provides a more accurate assessment of potential retracement points, and makes for more valid entries that are based on actual support/resistance parameters. The Fibonacci tools used in detecting potential retracement points are:
The most popular of these is the Fibonacci retracement tool. How was this tool developed to become an effective detector of possible price retracement entry points? It was found that when price retraced in a trend move, it usually did so to any of a sequence of numbers that correspond to horizontal lines at the 23.6%, 38.2%, 50.0%, 61.8%, 78.6% and 88.6% of the trend move's distance. These numbers were derived by Italian Mathematician Leonardo Fibonacci in the 13th century and are used to construct the Fibonacci ratios on which the Fibonacci retracement tool is built. Basically what traders should look for in a retracement trade is a bounce on the support level, or a rejection and pullback at the resistance level. Depending on the time frame and trade circumstances, additional confirmation can be sought from other candles or a candlestick pattern.
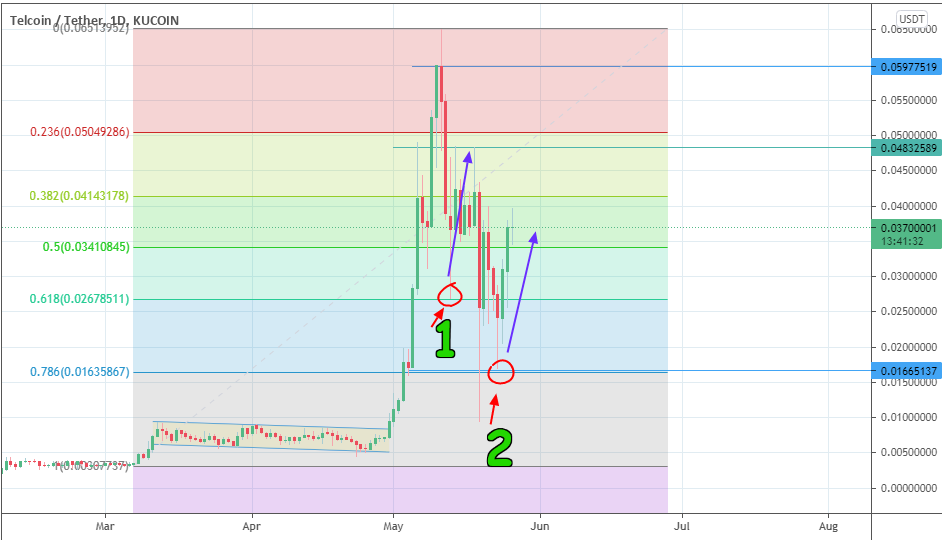
Retracement Long Trades
This example shows two retracement long trades. After the initial price spike, the price retraced towards the 61.8% mark (number 1), providing an opportunity to enter long and ride the trade to a prior resistance (blue arrow). Price dipped again, this time to the 78.6% retracement level (number 2), allowing for another long trade. Again, this trade was followed to the upside (2nd blue arrow).
Usually, the use of the Fibonacci tools requires the trader to trace the tool from a reference swing low to a swing high, if the trade is to follow the uptrend. Alternatively, you can trace the tools from a reference high to a reference low, if trying to trade corrective rallies within a downtrend.


