The essence of forex and CFD trading is to profit from the financial markets. To do this, you need tools and resources that give you an edge. The forex market is a zero sum market; money lost by others goes into the pockets of a few. To be among the few, you need to do things differently from the rest of the pack.
Forex trading platforms come with various trading indicators. These indicators are usually set by default, but there is also a chance to add custom indicators when trading with platforms such as the MT4 and MT5.
For this article, we will discuss a few native indicators as well as 2 custom indicators which have to be added to the MT4 from external sources.

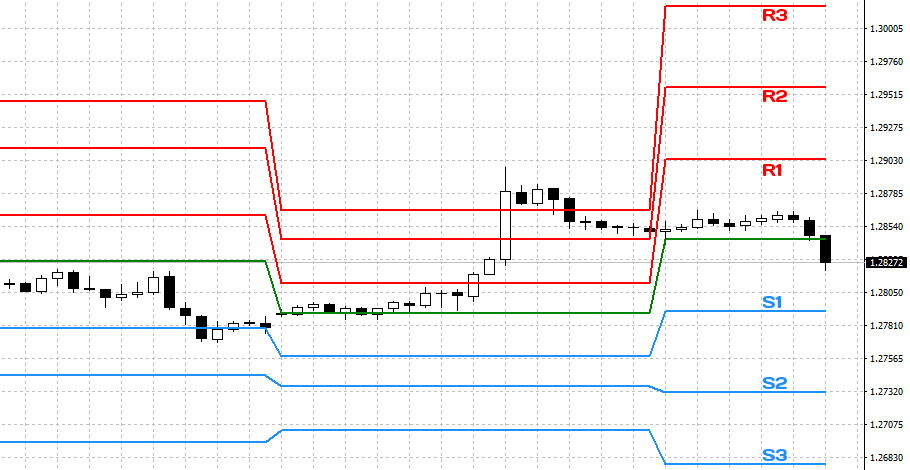
This custom indicator is used to derive pivot points on the chart from the previous day’s high, low and closing prices. Rather than subject yourself to the stress of manually calculating these figures every day, this indicator can do the job for you automatically.
There are two versions. One calculates the weekly pivot points, while the common version calculates the pivot points on a daily basis. The version to be discussed here is the daily pivot point calculator.
The automatic pivot point calculator is very useful for day trading, as it showcases the daily price levels where price can find support and resistance. There are three resistance areas and three support levels, as well as a central pivot. Despite the naming of each level either as a support or resistance pivot, the truth is that pivot levels above the market price can all function as resistance, and pivot levels below the market price can all function as support, be they resistance or support pivots.
They can be used alone or in combination with other tools/indicators to produce entry or exit trade signals. This indicator brings exactness to the table because they indicate where intraday price activity starts and stops. Using pivot points, it is easy to pick out up to 3-5 different setups on various currency pairs, and generate at least 20 pips on each one in a typically volatile trading day.

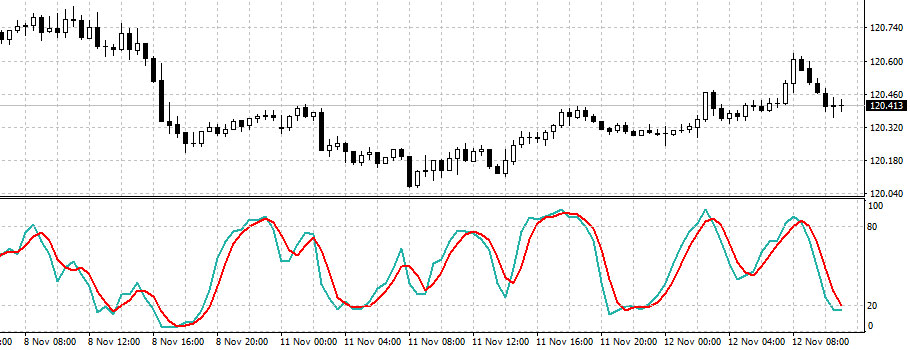
The stochastics oscillator is a momentum indicator which can be used in two ways:
These two use characteristics of the Stochastics oscillator come in very handy in detecting long-term and short-term price reversals. They can be used with other indicators and tools as well.
Price reversals are a sure thing in any financial market. When a trend has been pushed to near exhaustion, you need to know when the next move is coming. Oscillators are leading indicators. This means that the indicator shows a signal before the price actually responds in concord with the indicator.
As a divergence indicator the Stochastics oscillator’s lows can be connected with a short trendline. When the Stochastics is showing higher lows when price is showing lower lows, this is an indication that price could reverse upwards. Lower highs of the Stochastics oscillator at a time that the price action is showing higher highs is a sign of impending reversal to the downside. These signals must be followed by an actual candlestick behavior that will indicate that the reversal will take place.
Then we have the price extreme signals, where the Stochastics oscillator can be used to detect overbought and oversold price areas. I personally like to use this with the Fibonacci retracement tool to detect re-entries into the long term trend after price must have retraced.
The divergence and price extreme signals have a high degree of accuracy, which can be converted into profitable trades.

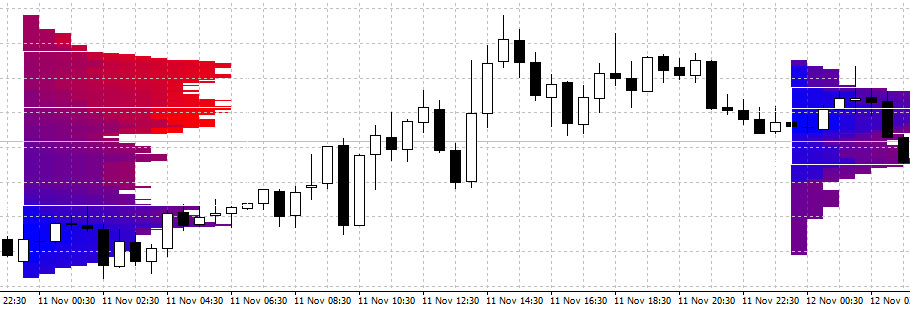
The market profile indicator is a custom indicator which is used to show on the charts, the areas where there is maximum bid or maximum offer volume for a currency pair or a CFD asset. By being able to see the price at which the institutional players are buying or selling an asset in the heaviest volumes, you can tell at what price you should be buying or selling an asset. By extension, you can also tell when the volumes of trade are so small that price changes will be negligible. That way, you do not get yourself stuck in lifeless trades.
There are various sources of the market profile indicator. Some are free, and others have to be paid for. While not promoting any version, you would need to do your due diligence when you have made a decision to get yourself a market profile indicator. This indicator is sometimes called the volume profile indicator because it shows the volume profile for any asset at any given time that the markets are active.
The advantage of the market profile indicator over other volume indicators is that it plots volume along the y-axis of price, and not along the x-axis. This provides better volume information at specific price levels, and is plotted as things are playing out as opposed to whe the action is already complete.

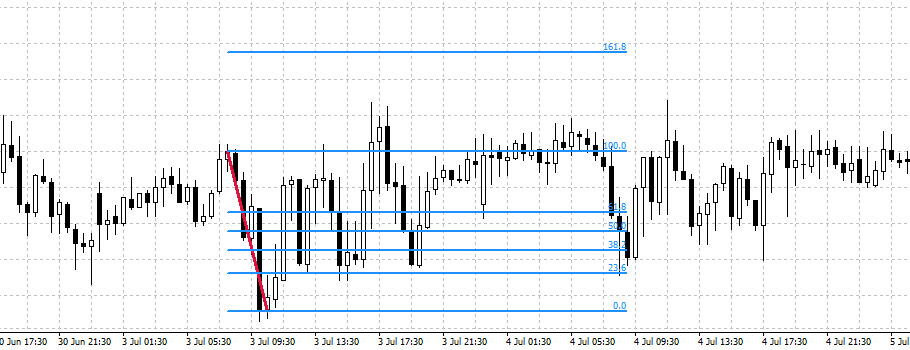
If you have never traded with the Fibonacci tools, then you are robbing yourself of great opportunities to make money in forex. Fibonacci tools are based on the number sequences discovered by a Mathematician known as Fibonacci several centuries ago. These numbers are used to detect retracement and continuation points, which correspond to the wave sequences found in price action as defined by Charles Dow and Elliot. Using the Fibonacci numbers, it is possible to trade retracements, Elliot wave sequences, and set price targets for re-entry trades.
The Fibonacci retracement tool is able to draw retracement areas at 23.6%, 38.2%, 50%, 61.8% and 78.6% retracement levels from swing lows to swing highs, or swing highs to swing lows in a downtrend. This enables the trader to get some idea as to where a retracement from a previous high or low will possibly end, thus providing re-entry opportunity into the long-term trend.
The Fibonacci expansion tool is used to define price targets from re-entry trades that have been defined by the Fibonacci retracement tool. Avoid giving back any profits to the market by exiting your retracement trades at the right moment.
There are other great tools and indicators which can be used in forex trading. It really all depends on proper usage of these indicators after getting an understanding of what they do. If you have noticed, the trend indicators such as moving averages have been left out. They are lagging indicators which tend to give signals when the moves are already far gone and the experience of this writer with them has been nightmarish to say the least. So they are off the table.