
The US Non-Farm Payroll report is regarded as arguably the second most important news release listed in the economic news calendar, secondary perhaps only to announcements regarding monetary policy such as the interest rate. It is usually released on the first Friday of every new month, and covers the employment data from the US for the previous month.
In recent years, there have been numerous occasions when the employment data from the US’s neighbour to the north (Canada) are released on the same day and the same time. This usually presents a trading challenge to new and some intermediate-level traders. At these times, it is a good skill to understand what works and what does not as far as the trading of both news releases is concerned.
The currency pair of choice is obviously the USD/CAD. This is a pair which pits the currencies of both countries against each other. The pair also has other influences too. The Canadian Dollar is a commodity currency. Canada’s oil sands harbour the second-largest oil reserves in the world, making the economy of Canada directly linked to crude oil prices. Therefore, it is a good idea to know what crude oil prices are doing at the time that you want to trade the employment data of both countries, using the USD/CAD.
The employment data of most countries, especially those listed on the economic news calendar, feature the unemployment rate, and the employment change.
The unemployment rate is expressed as a percentage. The lower the rate, the better for the economy. The higher the rate, the worse for the economy and its currency. We sometimes have static results, where there is no change in the unemployment rate from one month (or quarter as in the case of New Zealand) to the other. At this time, the employment change determines the direction of the sentiment towards the currency.
The employment change is a direct number which expresses the number of jobs added or lost by an economy. The higher the employment change, the better for the economy and its currency. The reverse is also true. It is extremely rare to see employment change remaining static, which is why it has the power to sway sentiment on the employment data if the unemployment rate is stagnant.
The employment change and unemployment rate have to work in an inverse relationship to produce a definitive price movement. At other times, the unemployment rate can remain unchanged, allowing the employment change to drag the sentiment in the same direction.
In other words, a higher employment change has to be accompanied by a lower or static unemployment rate for traders to assume bullish sentiment on the currency, leading to greater demand and a rush of buy orders. A lower employment change along with a higher /static unemployment rate is required to sour sentiment on the currency, leading to mass selling.
However, it goes a little further. Traders also have to study the actual number, and compare it with the previous number and the market consensus number, to determine the extent to which traders will demand (buy) or offer (sell) a currency. It is possible to have an economy have a positive employment change and a lower or static unemployment rate. But if that figure does not match the consensus, or has a serious shortfall from the previous number, you could have a negative response from traders and the currency will fall. You can also see the opposite occur. A lower-than-expected employment change with a higher or static unemployment rate, may also produce a positive response if the numbers are trending towards an improvement from previous months’ data.
If you are confronted with that Friday when the employment data for the US and Canada are released at the same time, do not despair. The secret to trading the USD/CAD in this circumstance lies in a performance comparison of the two data sets. You compare the employment data from Canada and that of the US, and make an informed decision on which of the two data sets is better or worse than the other. Once you make this determination, you buy the currency with the better data, and sell the currency with the worse data.
The dilemma is how to determine which of the two data sets is better or worse than the other. You do not need any complex calculations to determine this. What you do is to look at the consensus and previous numbers of the last two or three months to get a pattern of whether the data sets are improving, worsening or simply have a choppy pattern.
Look at the actual number, and see if you can calculate the percentage to which the actual numbers have improved or worsened. Compare this with the data from other currency. When you do this, you would be able to spot which of the two countries has done better in adding jobs or not.
Take a look at the crude oil chart and see if it tallies with your decision on the CAD. Ideally, if you have reviewed the employment data of the US and Canada and agreed to sell the USD/CAD, rising crude oil prices will help the cause of this trade as it will impart more strength to the loonie. If the price of crude oil is falling in such a circumstance, any gains on a sell position on the USD/CAD will be limited. If the fall in crude oil prices is quite steep, your sell position may even reverse and send you into a losing position.
Let us analyse the example presented in this chart on February 5, 2021 when the US and Canadian Employment Data were released at the same time.
US Employment Data
Canada Employment Data
A mere glance at the numbers shows that the US employment data showed an improved employment situation, while that of Canada showed a worsening situation.
This should have been a straight buy for the USD/CAD, or was it?
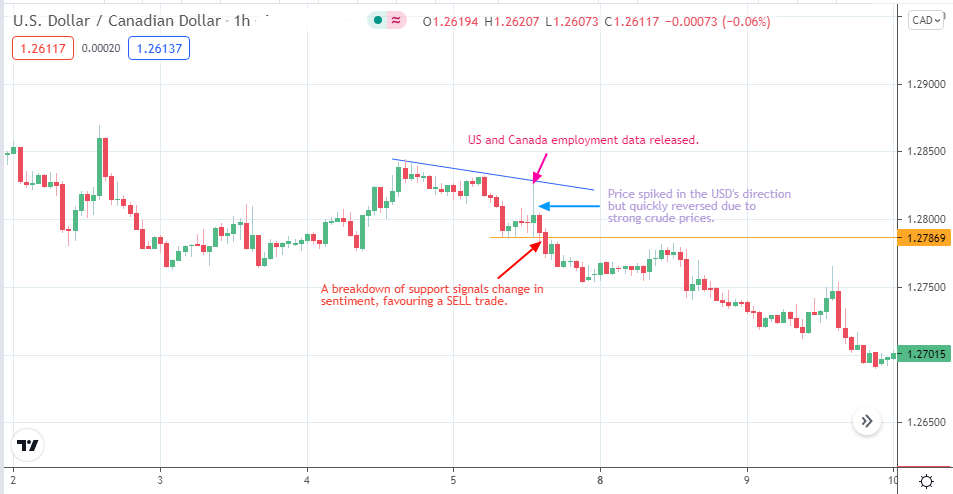
USD/CAD: Feb 5, 2021
A look at oil prices showed that crude oil prices were strongly trending in an upward direction, which provided so much strength to the CAD that it caused the trade to reverse, just as we said earlier.
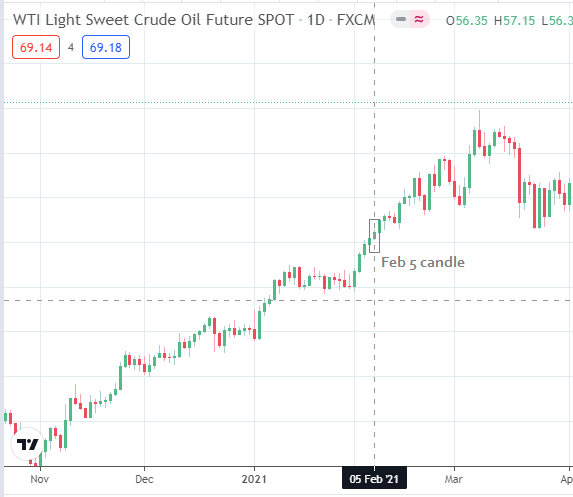
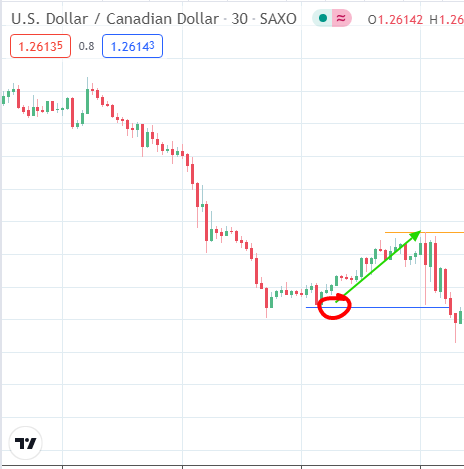
WTI Crude Oil: Feb 5, 2021
The encircled candle shows the time the combined employment data for the US and Canada were released in the Feb 5 USD/CAD chart shown above. This shows crude oil prices trending upwards and continuing to trend higher, giving the CAD added strength that enabled it to overcome the sentiment on the employment data.
This example was provided to show that crude oil prices can override the impact of employment data if the prices on the WTI or Brent crude benchmarks are trending strongly.
Let us look at the May 7 situation. On this day, crude oil prices ended the day more or less unchanged, which nullified its impact on the outcome of the double NFP release.
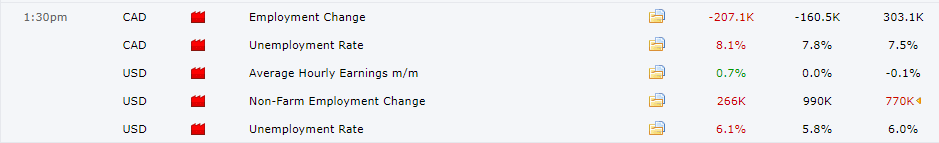
The unemployment rate of the US climbed 0.1%, while that of Canada climbed 0.6%. The consensus differential from the actual number was 0.3% for both US and Canada.
Employment change for the US saw a positive change, despite a shortfall from the consensus. Canada’s employment change had a negative move; a lot of jobs were actually lost.
The outcome favours the USD, so would a USD/CAD long order have worked here without the influence of crude oil prices?
USD/CAD: May 7, 2021
The trade was good for 50 pips, but not much more. However, a 50-pip move considering the circumstances would not have been a bad outcome, despite the market risk.
So next time you are confronted with a double dose of employment data from the US and Canada, you would know how to trade it.


