
Bitcoin trading has evolved significantly over the years, moving beyond simple price charts and technical indicators. Today, many traders are using on-chain analysis to gain a deeper understanding of Bitcoin's market dynamics.
On-chain analysis involves examining data directly from the blockchain to gain insights into market behavior and predict future price movements. In this article, we'll explore some of the top Bitcoin trading indicators derived from on-chain analysis and how you can use them to enhance your trading strategies.
Put simply, on-chain analysis refers to the examination of blockchain data to assess the health and activity of a cryptocurrency such as Bitcoin. By analyzing metrics such as transaction volume, wallet balances, and the movement of coins, traders can gain valuable insights that are not available through traditional technical analysis. This includes getting a comprehensive view of market sentiment and investor behavior, which can be powerful for traders looking to profit in the markets.
Transaction volume measures the total amount of Bitcoin being transacted on the blockchain over a specific period. High transaction volumes often indicate increased market activity and interest, which can signal potential price movements. Conversely, low transaction volumes may suggest a lack of interest and potential price stagnation.
How to Use It: Monitor transaction volume trends over time. A sudden spike in transaction volume can indicate a potential price breakout or breakdown. Consistently high volumes may support a bullish trend, while declining volumes can be a bearish signal.
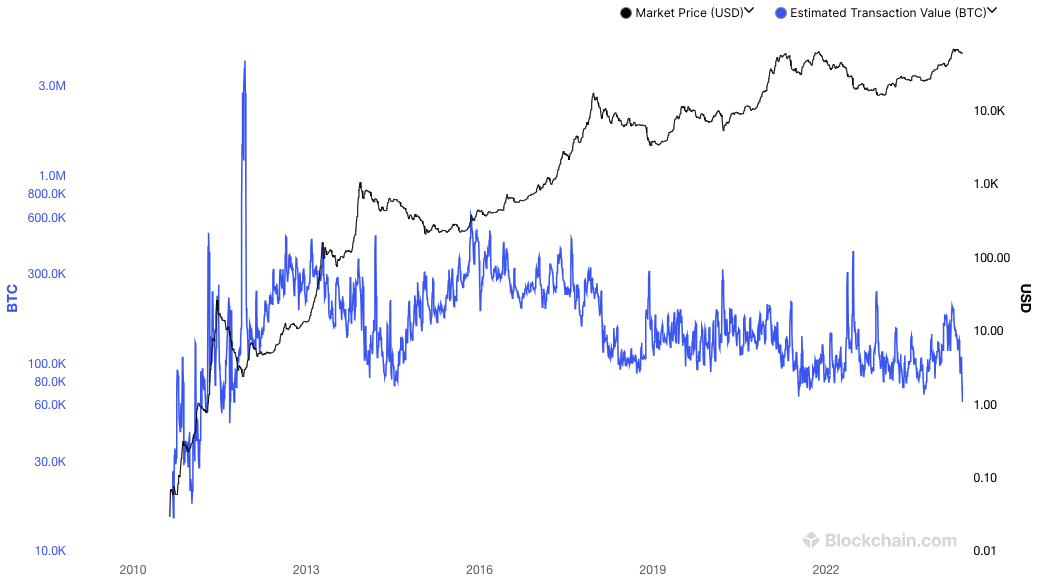
The number of BTC transacted each day (blue line) and the Bitcoin price (black line). Source: blockchain.com
Active addresses refer to the number of unique addresses participating in transactions on the Bitcoin network. An increasing number of active addresses suggests growing user adoption and network activity, which is often seen as a bullish indicator.
How to Use It: Track the daily or weekly number of active addresses. A rising trend in active addresses can signal growing interest and usage, potentially leading to higher prices. Conversely, a declining trend may indicate waning interest and possible bearish price action.
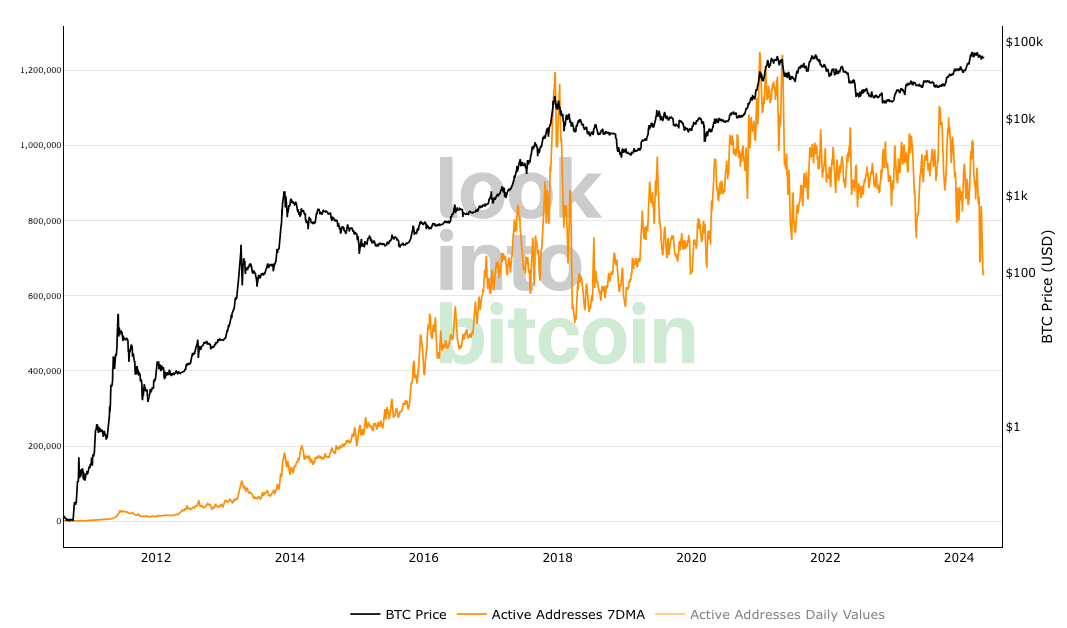
Bitcoin number of active addresses (orange line) and price (black line). Source: lookintobitcoin.com
Hash rate measures the total computational power being used to mine Bitcoin. A high hash rate indicates a strong and secure network, with more miners participating in the validation process. The hash rate can also reflect miner sentiment, as miners are more likely to mine when they expect higher prices.
How to Use It: Observe changes in the hash rate over time. A rising hash rate typically signals confidence in the network and can be a bullish indicator. A declining hash rate might suggest miners are shutting down operations, possibly due to lower price expectations, which could be bearish.
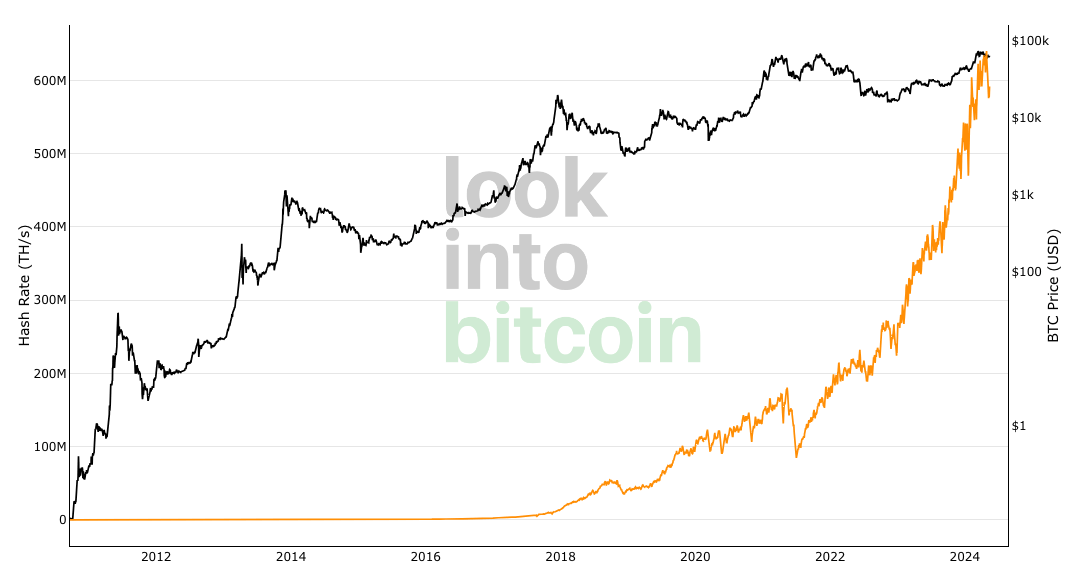
Bitcoin hash rate (orange line) and price (black line). Source: lookintobitcoin.com
Miner revenue represents the total earnings of Bitcoin miners, including block rewards and transaction fees. Higher miner revenue generally indicates a healthy network and can reflect positive market sentiment.
How to Use It: Monitor miner revenue trends. Increasing miner revenue can be a bullish sign, indicating a profitable and secure network. Decreasing revenue might suggest potential challenges for miners, which could negatively impact market sentiment.
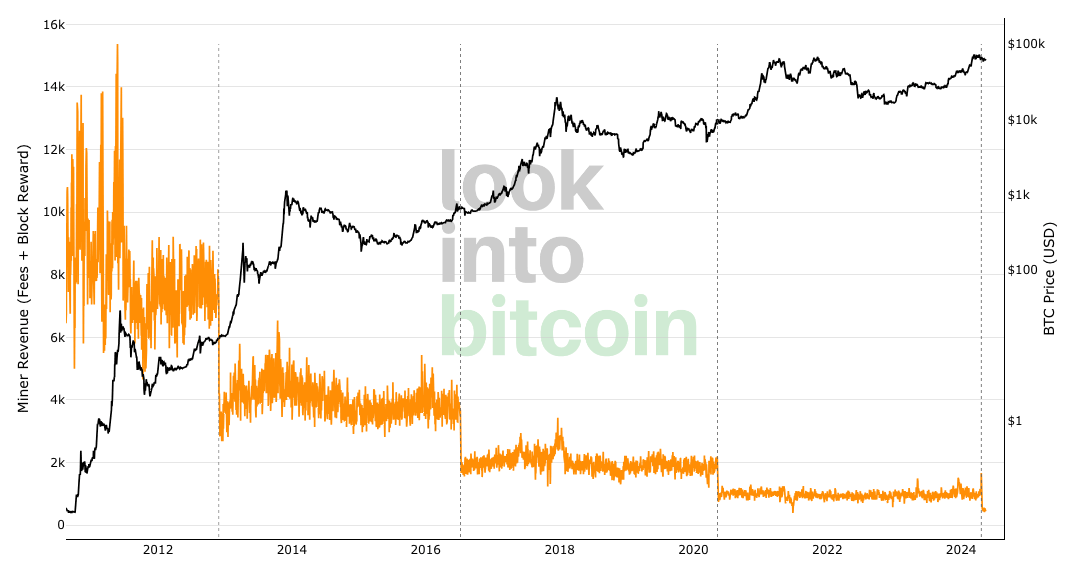
Bitcoin miner revenue (orange line) and price (black line). Source: lookintobitcoin.com
Exchange inflows refer to the amount of Bitcoin being transferred to exchanges, while exchange outflows refer to the amount being withdrawn from exchanges. Large inflows can indicate selling pressure as investors move coins to exchanges to sell them. Large outflows typically suggest accumulation and holding sentiment, as investors move coins off exchanges and to their personal wallets.
How to Use It: Track significant changes in exchange inflows and outflows. Large inflows may precede price declines due to increased selling pressure. Conversely, large outflows might precede price increases as supply on exchanges decreases.
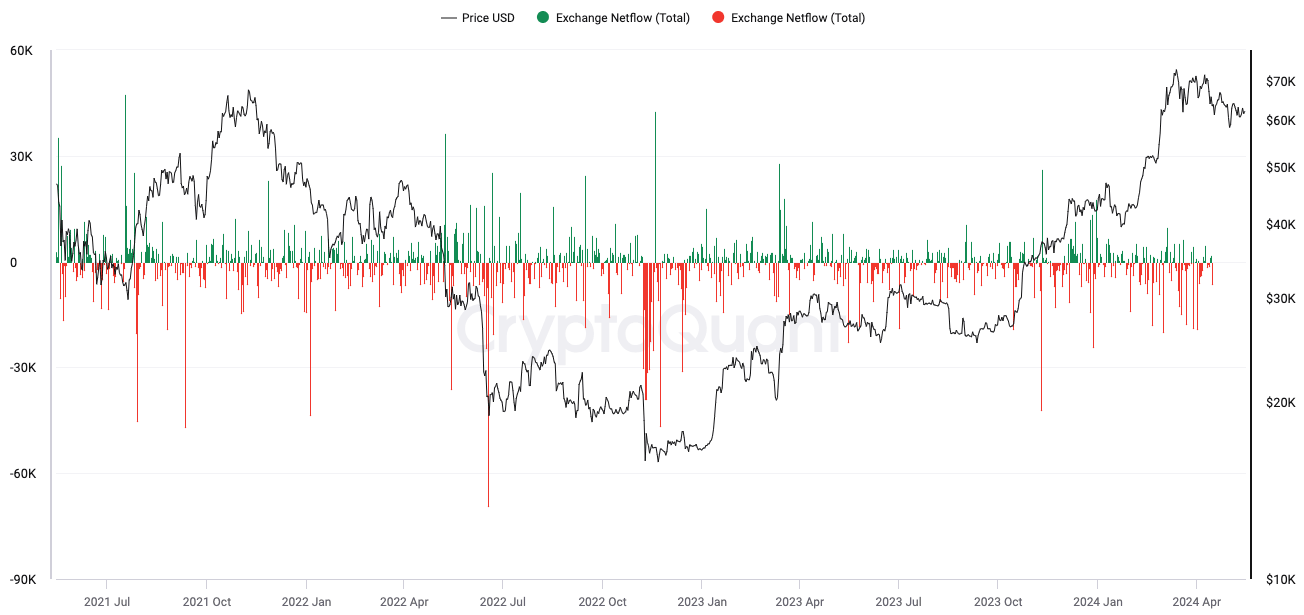
Exchange inflows and outflows. Source: cryptoquant.com
HODL waves visualize the age distribution of Bitcoin holdings, showing how long Bitcoin has been held in wallets. Different color bands represent coins held for varying periods, from less than a day to over ten years.
How to Use It: Analyze the shifting patterns in HODL waves. An increase in the proportion of coins held for longer periods can indicate strong holding sentiment, which is bullish. Conversely, an increase in the proportion of recently moved coins might signal potential selling pressure, which could be bearish.
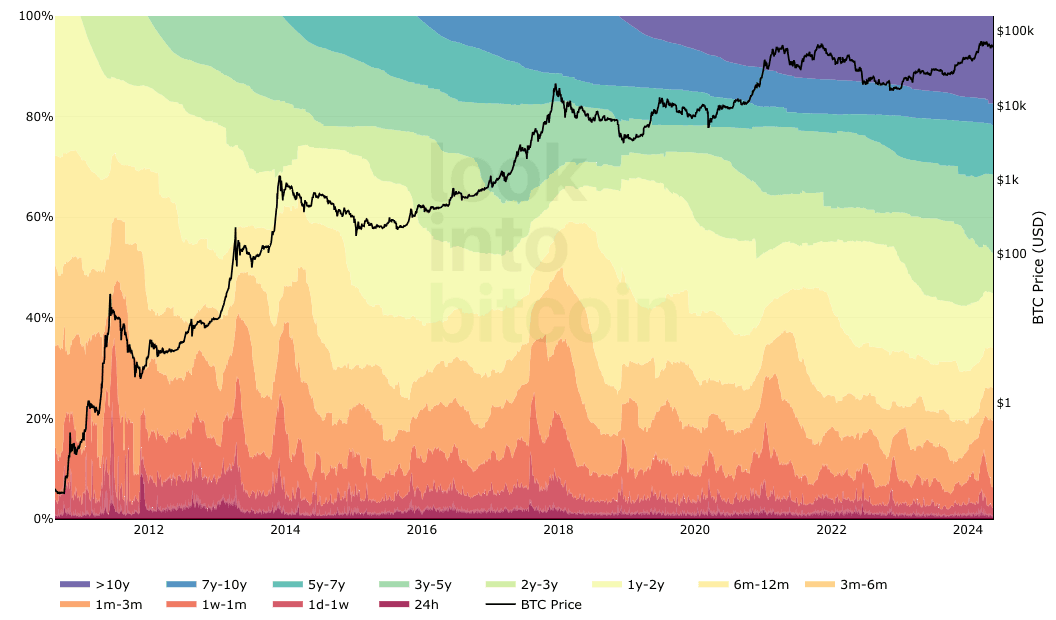
Bitcoin HODL Waves and price. Source: lookintobitcoin.com
The MVRV ratio compares Bitcoin's market capitalization (current price) to its realized capitalization (the price at which each Bitcoin last moved).
An MVRV ratio above 1 suggests that Bitcoin is trading above its average cost basis, which can indicate overvaluation. A ratio below 1 suggests undervaluation.
How to Use It: Use the MVRV ratio to identify potential buy and sell opportunities. When the MVRV ratio is significantly above 1, it may indicate a market top and a good time to sell. When the ratio is below 1, it could signal a market bottom and a potential buying opportunity.
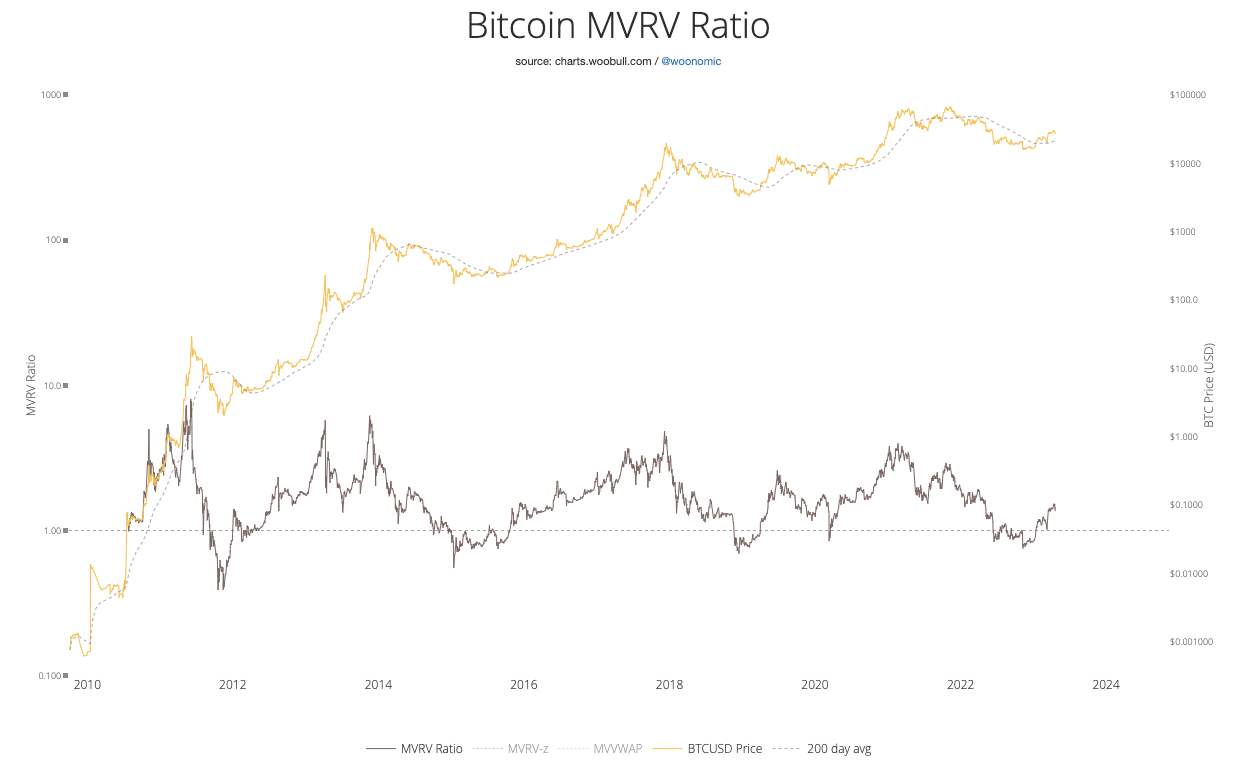
Bitcoin MVRV Ratio. Values significantly above 1 indicate overvaluation and values significantly below 1 indicates undervaluation. Source: charts.woobull.com
SOPR measures the profit or loss of spent outputs on the blockchain. It is calculated by dividing the realized value (price at which coins were sold) by the value at creation (price at which coins were acquired).
A SOPR value above 1 indicates that coins moved at a profit, while a value below 1 indicates a loss.
How to Use It: Monitor the SOPR for market sentiment insights. A SOPR consistently above 1 suggests that traders are selling at a profit, which can be bullish. A SOPR below 1 indicates selling at a loss, which may be bearish and signal capitulation.
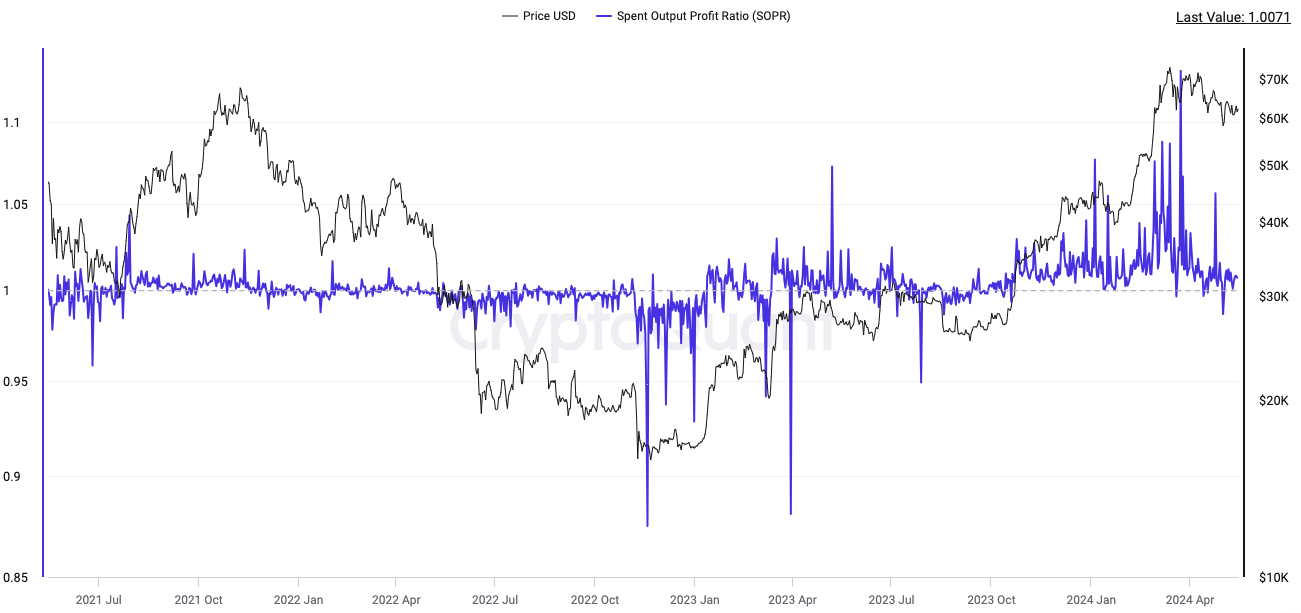
Bitcoin Spent Output Profit Ratio and price. Source: cryptoquant.com
The NVT ratio compares Bitcoin's market capitalization to its transaction volume. A high NVT ratio suggests that the network value is high relative to the amount of value being transacted on-chain, which can indicate overvaluation.
How to Use It: Use the NVT ratio to assess market valuation. A rising NVT ratio may indicate an overvalued market and potential price correction. A declining NVT ratio could suggest undervaluation and a potential buying opportunity.
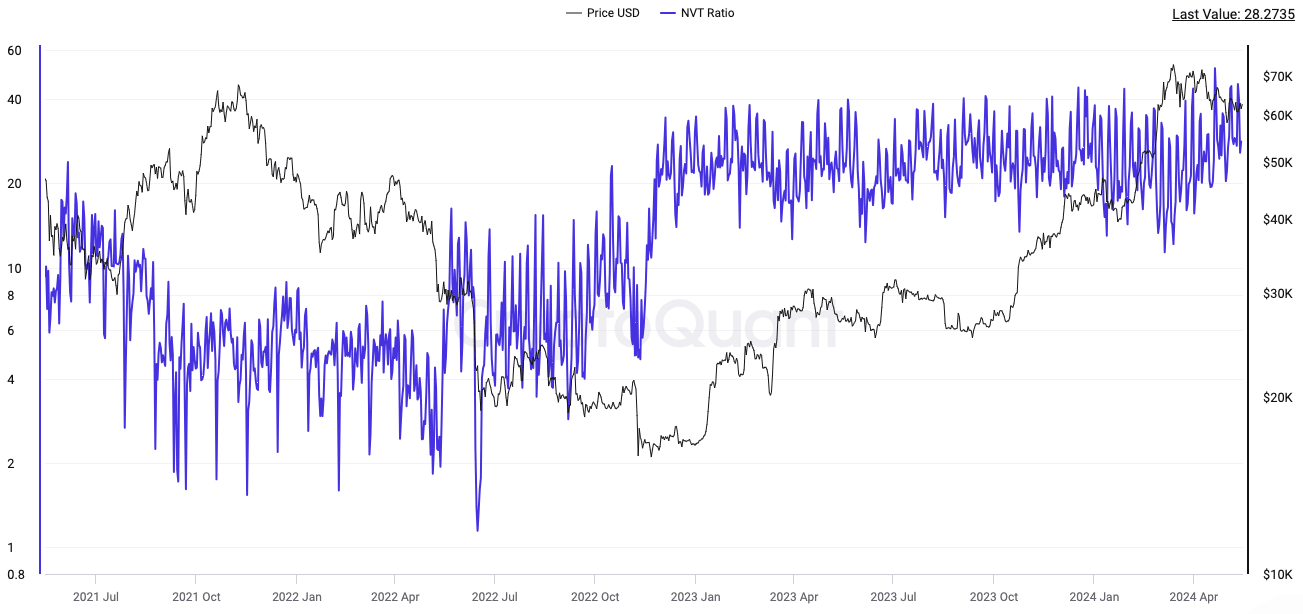
Bitcoin NVT Ratio. Source: cryptoquant.com
It should be clear by now that on-chain analysis provides a wealth of data that can help traders gain deeper insights into Bitcoin's market dynamics. By using indicators such as transaction volume, active addresses, hash rate, miner revenue, exchange inflows and outflows, HODL waves, MVRV ratio, SOPR, and NVT ratio, even new and inexperienced traders should be able to make more informed decisions and potentially enhance their trading strategies. Remember, no single indicator can guarantee success, but combining multiple indicators can provide a more comprehensive view of the market and improve your chances of profiting from Bitcoin trading!


