
Indicators are tools that are intended to facilitate intelligent trading decisions. The MT5 trading platform comes with an expanded indicator suite, giving traders the advantage of having additional tools to work with. There have also been some modifications to the tools that are available. These tools are supposed to be used with some of the indicators to produce certain results.
The challenge that today’s traders face is that the FX and CFD market has undergone several changes. Many indicators are more than five decades old and have not kept pace with the dynamism of the markets. This now behoves traders to ensure that they only trade with the top 3 MT5 indicators that have stood the test of time and which remain relevant today as they have been in years gone by.
So what are the top 3 MT5 indicators you can use today?
The DeMarker indicator is a momentum indicator which is used to gauge the market demand for an asset. It compares the asset’s current high and low prices with previous highs and lows and plots the market demand as a line on the indicator window. The DeMarker indicator is composed of the DeMax and DeMin moving averages. The DeMax is the component that does the comparisons of the price highs, while the DeMin handles the price low comparisons. These two combine to produce the signal line on the indicator window.
The vertical range is from 0.0 to 1.0, but unlike its listing on the MT4 platform, it occasionally steps out of this range if the market is deeply overbought or oversold. If the signal line of the DeMarker indicator rises above 0.7, the asset is considered overbought. The asset is oversold if the value of the indicator is 0.3 or lower.
Like other oscillators, its main use as a top 3 MT5 indicator is in detecting divergence situations. The DeMarker indicator is a leading indicator and points to a price change in the opposite direction before the market adjusts. The divergence opportunity exists when the peaks or troughs of price is facing in the opposing direction from those of the DeMarker’s signal line. The expected correction of the divergence by the price action provides the trade opportunity.
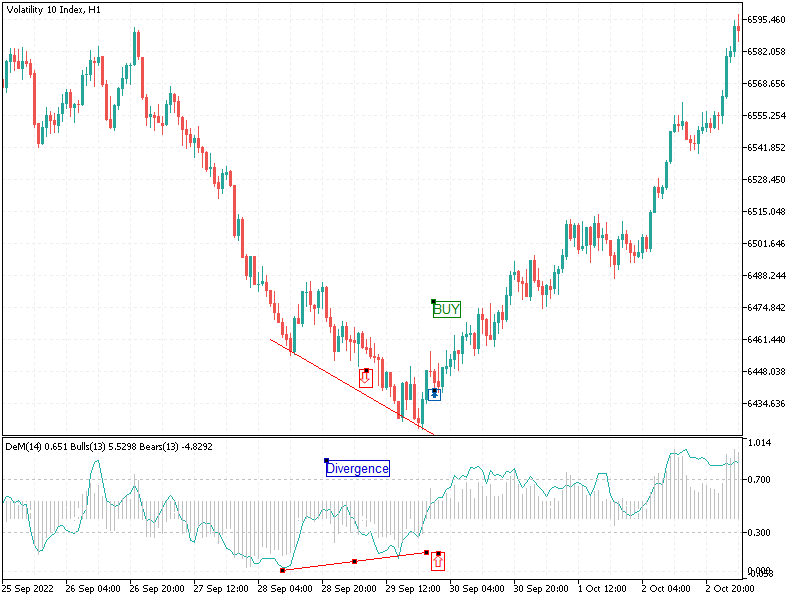
The visual effects of the indicator’s peaks and troughs are enhanced if you also click and drag the Bulls and Bears oscillator indicators from the Navigation window on the left onto the DeMarker indicator window. The Bears/Bulls indicator appears as a series of vertical bars on the indicator window, having a midpoint that corresponds to that of the DeMarker indicator. The divergence signals of the indicator are enhanced if the peaks are above 0.7 (overbought) and the troughs are below 0.3 (oversold).
To attach the DeMarker indicator to the MT5 chart, click on Insert -> Indicators -> Oscillators-> DeMarker
The Stochastics oscillator is a classical momentum indicator with a vertical range that starts at 0 and ends on top of the indicator window at 100. Apart from being used to spot divergences, it used to detect the market extremes. Values above 80 are deemed to be overbought, while values below 20 show a market that is oversold.
In trading with the MT5, the Stochastics oscillator works well as a detector of market extremes, usually in combination with other indicators that will be presented below.
The Stochastics oscillator has two lines: the %K and %D. The %K is the current price of the asset in relation to the recent range of prices displayed by the asset. It is the difference between the highest and lowest prices over a specified period. It also has a moving average component, set to read the average price of the asset in fourteen periods (i.e. 14). The %D is the 3-period moving average of %K. Some people call the %D the fast Stochastics line and the %K the slow Stochastics line.
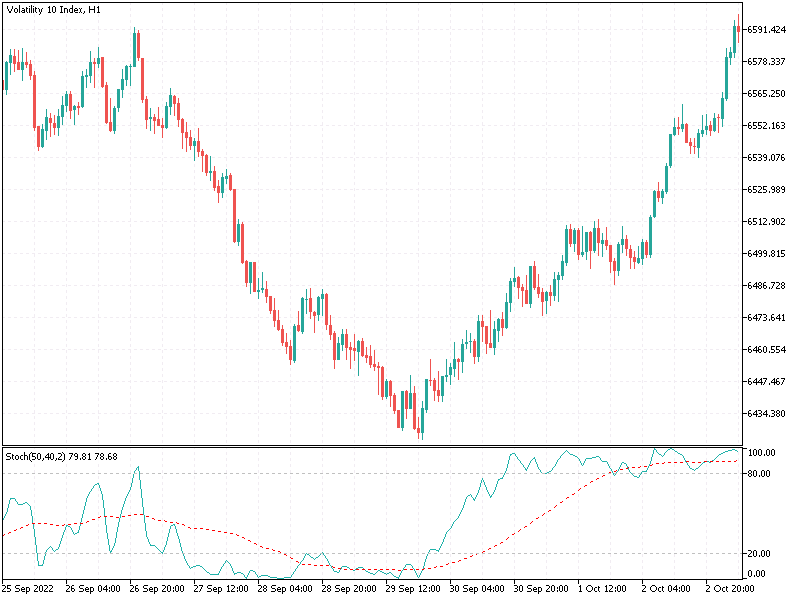
This indicator has been around since the 1950s, but it has stood the test of time. The beauty of the Stochastics oscillator is that its parameters can be adjusted to suit the trader’s needs. One of the common settings the writer uses is to set the %K to 50, the %D to 40 and the moving average to 2 (i.e. 50, 40, 2). This setting ensures that the oversold/overbought signals are heavily filtered, almost guaranteeing a near-perfect outcome.
We talked about this indicator in the Top 3 MT4 Indicators article. So why is it coming up for mention here? This is because Goichi Hosoda's Ichimoku Kinko Hyo indicator can be adapted for use in the MT5 platform in a way that is presently not possible in the MT4. In the MT5, the indicator can be stripped of some of the components and placed directly in the indicator window, and allowed to interact with other indicators to produce crossover signals, or signals picked off the interaction of the Kijun line with the market extremes of oscillators.
The Ichimoku Kinko Hyo has the following components:
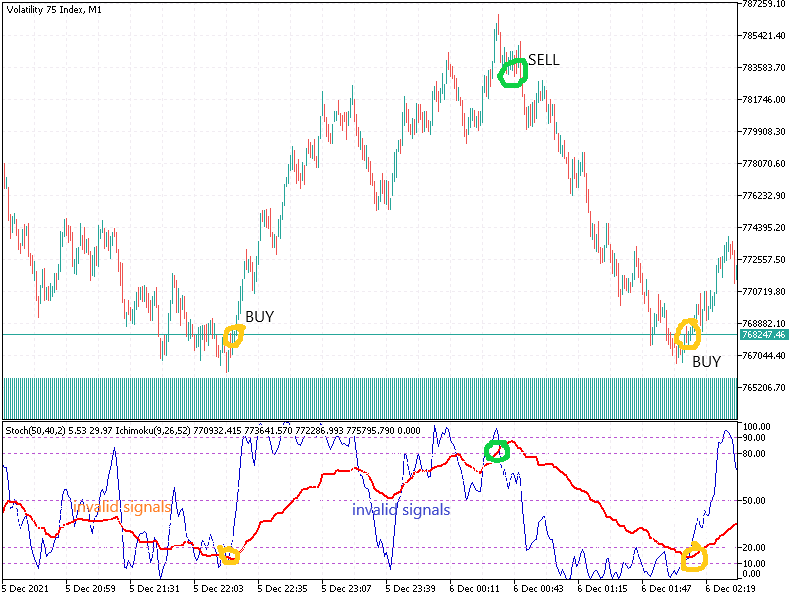
As a top 3 MT5 indicator being used to interact with other oscillators from within the indicator window, the Kumo, Senkou span lines and the Chikou span line are not of much importance. The most important component is the Tenkan Sen. This line can perform crossovers on some of the oscillators such as the Stochastics indicator, as shown in the chart below.
The Ichimoku Kinko Hyo indicator is listed as a trend indicator on the MT5 chart. In order to use it in the manner described above, the trader must change the colour of the other components of the indicator (Kumo, Chikou span, Kijun sen and Senkou span lines) to white, if the chart background chosen is the “black on white” or “colour on white” colour formats. This makes them invisible, leaving the Tenkan sen as the only visible component. Also, the indicator is dragged to the indicator window and not on the chart. To do this, go to the Navigator window on the left side of the page, click on the + sign beside Trend, then click and drag the Ichimoku Kinko Hyo icon to the oscillator’s indicator window.
When these changes have been made, the Tenkan sen component of the Ichimoku indicator can interact with the signal lines of oscillators as though it was performing a crossover. The difference here is that any such crossovers must occur in the market extreme areas to be of use to the trader. Only then can this indicator function as a top 3 MT5 indicator.


