
Indicators are tools that are supposed to aid the forex or CFD trader in making intelligent trading decisions. On the MT4 indicator, there are indicators. However, the challenge traders of this third decade of the 21st-century face are that the financial markets are highly dynamic and have changed so much in the last few years. Many of these indicators are at least 50 years old and can no longer be used as accurate market predictors as they have not kept pace with the changes of the last few years.
However, a few of these indicators have remained as reliable as ever. You can still use them in predicting market direction when the news is not an active influencer of price movements.
This is why this article aims to describe the top 3 MT4 indicators as far as 2023 and beyond is concerned. The indicators in question are:
The Relative Strength Index (RSI) measures the speed and rate of price movement. Created by J. Welles Wilder, the Relative Strength Index is a momentum indicator widely used in forex. This momentum indicator can detect overbought and oversold market conditions. The RSI's vertical range is between 0 and 100, where any value >70 is overbought and values <30 represent oversold conditions.
The Relative Strength Index has a signal line, calculated as:
RSI = 100 - (100 / (1 + RS))
The result of this calculation is automatically plotted on a forex chart as the signal line . Click on Insert -> Indicators -> Oscillators -> Relative Strength Index to add the RSI to the MT4 chart. The period is automatically set to 14, but you can adjust this as you wish.
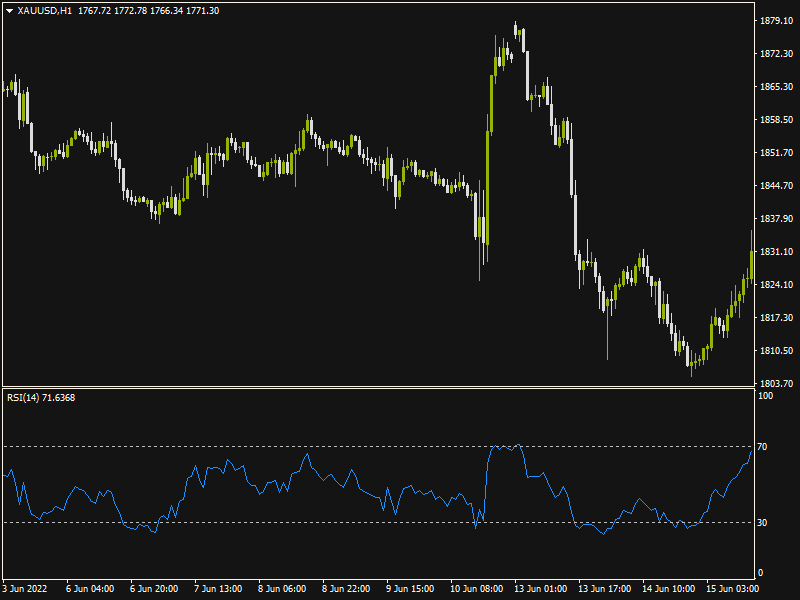
What makes the RSI one of the top 3 MT4 indicators in FX trading? This is because it can spot divergences, providing accurate divergence signals. The divergence occurs when the tops and bottoms of the RSI's signal line start to move in a different direction from the tops and bottoms of the price bars/candles. The RSI is a leading indicator that points to a potential price change before it happens. The divergence is the main feature that showcases this characteristic.
When a divergence occurs, the price action will follow in the indicator's direction to correct this divergence. So if you spot the RSI divergence early, you can trade off it and pocket some profits. The divergence works for long and short trades, making the RSI one of the top 3 MT4 indicators.
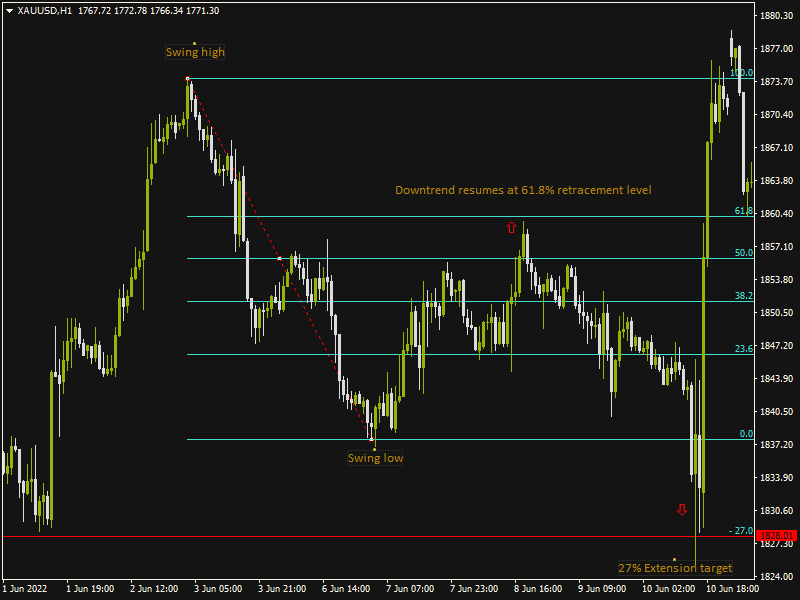
Retracements and resumption of price moves in a trend have been a feature of the markets from day one and will continue to be. So every trader will need a tool to pinpoint where market retracements end and where the trend resumption will also conclude. This is why the combined Fibonacci retracement and extension tools come into place and are one of the top 3 MT4 indicators.
On the MT4, you will not see these tools under any indicator class. They are seen more as tools and will be found under the Tools tab as separate tools. However, you can plot extension levels on the Fibonacci Retracement tool as part of your indicator settings adjustments.
The Fibonacci Retracement indicator is one of several tools that are based on number ratio sequences defined by an Italian mathematician after whom the tool is named.
Each Fibonacci sequence is a string of fourteen integers, where the following number is generated by adding the previous and the current number. So in the 0,1,1,2,3,5,8,13,34,55,89,144 and 233 number sequence, you will see that the following number is the current number + the last number. When you divide the last number by the current number, you get values close to what is known as the Golden Ratios. These ratios are 0.236, 0.382. 0.5, 0.618, 0.786, 0.886, 1.0, 1.272, 1.414, 1.618, etc. Any ratios above 1.0 are the extension levels, while ratios below 1.0 are the retracement ratios.
Fortunately, the Fibonacci Retracement tool plots these ratios automatically on the MT4 chart. You can use the extension levels to add extension points on the retracement tool. Add the - sign on the extension if the extension levels start from 0.27, to 0.618, in that order. You can add extension levels using the Ctrl + I shortcut.
The Fibonacci retracement tool has a dotted trendline used to plot across a price swing (i.e. from a recent top to bottom in a downtrend or from a recent low to a recent high in an uptrend). It also has retracement levels. These are drawn on completing the trace of the dotted line across the extremes of a price swing.
You can also set the Fibonacci retracement tool to adjust once new price data automatically enters the charts. You can access the tool and add it to the MT4 chart by clicking Insert -> Fibonacci-> Retracement. Click on the "Use last X bars" option when adjusting the tool's settings to activate this function.
Once the Fibonacci retracement levels have been defined, they can act as areas of previous support or resistance when there has been some additional price action.
Goichi Hosoda's Ichimoku Kinko Hyo indicator is not one many traders like to use because of its apparent complexity. It is a top 3 MT4 indicator that has stood the test of time. The blowout factor for this indicator is that it has multiple components that can be used in different ways. Talk of an indicator that can be used to create several trading strategies, and the Ichimoku Kinko Hyo probably comes first.
The Ichimoku Kinko Hyo has the following components:
The Kumo is the main component and appears on the MT4 chart as a large, shaded area between the Senkou span A and B lines. There is the Up Kumo seen in uptrends and the down Kumo seen in downtrends.
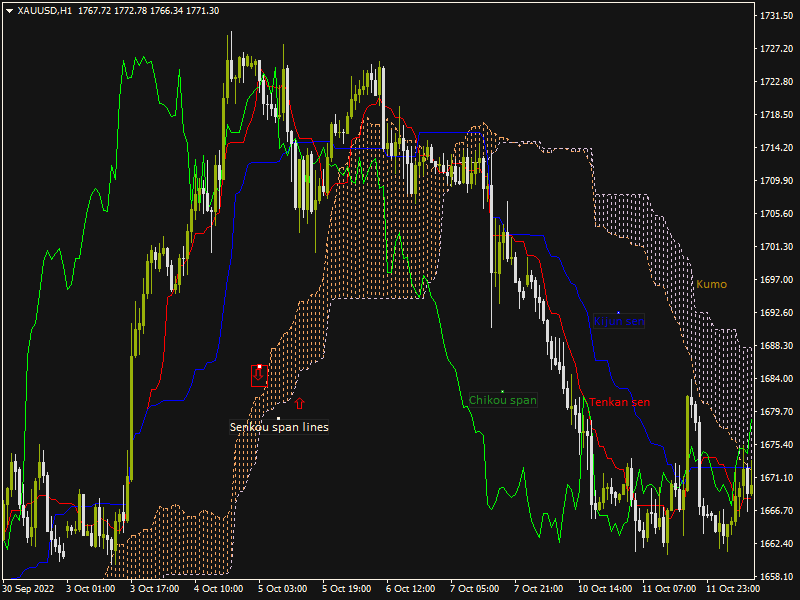
The Kumo is a robust support-resistance tool and can also be used for range/trend trading. As a support-resistance tool, Senkou span lines act as support levels when the price is above the Kumo. When the price is below the Kumo, the Senkou span lines form sequential resistance levels. The market usually consolidates into a range when the price is within the Kumo. A price break of the Kumo to the north or south is indicative of a new trend forming. The information nuggets here are used in deciding trade entries and exits.
The Senkou span lines act as support and resistance tools in the manner described above, spending on the location of the price relative to the Kumo.
The Tenkan Sen and Kijun Sen ("sen" means line) are used to trade trend reversals and breakouts. The cross of the Tenkan line above or below the Kijun line (TK cross) is a trend reversal trade, indicating the trader to buy or sell in the direction of the TK cross. This is a bit like when there is a moving average crossover.
The Ichimoku Kinko Hyo indicator is listed as a trend indicator on the MT4 chart. To attach it to the MT4 price chart, click on Insert -> Indicators -> Trend -> Ichimoku Kinko Hyo.
The Chikou span line is used as a trade filter rather than a signal to buy or sell. The location of the price relative to the Chikou span determines if the price is trending upwards or downwards or if it is range-bound. Price above the Chikou is a bullish filter, and a bearish filter is seen when the price is below the Chikou span.


