
Price activity in the financial markets does not occur in a straight line. Rather, it moves in waves, rising and ebbing according to the psychology of the market participants. This psychology is what produces demand and supply of financial assets, leading to rise and fall in prices. These periods were prices rise and fall are encapsulated in the Dow Theory, and redefined by Elliott wave analysis.
The Elliott Waves method of technical analysis was invented by Robert Nelson Elliott. As you will notice, this method of analysis was also named after him. The basis for Elliott wave analysis is that the movements of price in the financial markets usually occur in a cycle of wave patterns which are repetitive. By studying and using this repetitive wave patterns to analyse current price action, a trader can predict periods where prices will rise to form peaks and ebb to form troughs.
The typical Elliott wave pattern has 5 impulse/motive waves and 3 corrective (retracement) waves.
A) Impulse Waves
The impulse waves flow in the direction of the trend and are 5 in number: these waves are known as waves 1, 2, 3, 4 and 5. These are the waves that drive the primary trend. These waves are not random waves. They have defined lengths in relation to each other and tend to obey the principles of the Fibonacci numbers. The impulse or motive waves are the price waves that follow the trend. The impulse wave sequence has 5 waves: 1-2-3-4-5, where 1, 3 and 5 point in the trend direction and 2 and 4 point against the trend, being retracements of waves 1 and 3. Each wave is made up of smaller waves. Waves 1, 3 and 5 (which follow the trend in the motive wave sequence) are subdivided into 5 waves. Waves 2 and 4 which go against the trend in the motive sequence are made up of 3 waves.
B) Corrective Waves
The corrective waves go against the trend are 3 in number. These waves are known as waves a, b and c. These are the retracement waves that mark the price correction from the primary trend which is defined by the impulse waves.
The corrective waves are the waves that retrace against the trend. They are therefore counter-trend waves. The corrective wave sequence has 3 waves: a-b-c where waves “a” and “c” point against the impulse wave trend and wave b points in the direction of the impulse wave trend.
There are three types of corrective waves:
It is pertinent to remember that markets can be in an uptrend or downtrend. Therefore, motive waves lead upwards in an uptrend, and lead downwards in a downtrend. The corrective waves lead downward in an uptrend, and upward in a downtrend.
The principle of the Elliott wave pattern states that market prices tend to alternate between a motive/impulsive phase which follows the trend, and a corrective phase which goes against the trend. These phases can be seen on all time frames.
The wave patterns and the corrective sequences follow the Fibonacci numbers. The sequence of the impulse and corrective waves in the very simplified format is shown below. The word “simplified” is used because each wave tends to be made up of smaller waves, just the way the ocean waves are made up of tides, and tides are made up of ripples.
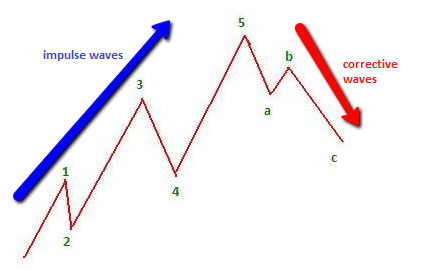
Elliott wave pattern in an uptrend
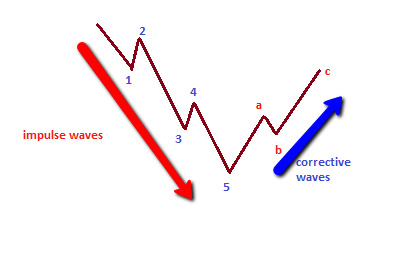
Elliott wave pattern in a downtrend
This simple representation of the Elliott Wave pattern displays the 1-2-3-4-5 impulse wave sequence, followed by the a-b-c correction wave sequence. Within the impulse/continuation sequence, waves 1, 3, and 5 are the progressive waves while 2 and 4 are correction waves.
When deciphering potential Elliott Wave patterns on a price chart, it is important that any waves detected obey three rules. These are:
– Wave 4 must not overlap into the price territory of wave 1.
– Wave 2 is a retracement wave within the impulse wave component of the Elliott waves, but this retracement cannot be more than 100% of wave 1. Usually, the retracement follows the Fibonacci ratios.
– Wave 3 is usually the longest of all the waves in the impulse wave. It therefore cannot be the shortest wave.
Elliott wave patterns are principally used to detect price continuation and pullback areas. Simply put, a trader needs to know when the wave is surging or when it is ebbing. The entire essence of trading is principally to follow the trend (i.e. when the waves are surging). This enables the trader to setup trade entries and exits as appropriate.
Following on from the above, successful trading using the Elliott Wave principles requires the trader’s ability to do the following things:
1) Pinpoint the starting points of waves 3 and 5, which are the trend continuation waves within the 1-2-3-4-5 impulse wave setup.
2) Determine when the pullbacks have started to occur after waves 1 and 3. In essence, these are waves 2 and 4. It is not usually advised to trade against the trend, so these waves are essentially not for trading but for understanding when not to trade.
3) Determine the end of the impulse wave setting, and the commencement of the a-b-c corrective wave sequence.
Please understand that the trend continuation waves of 1, 3 and 5 within the impulse wave setting have 5 constituent subwaves, and the retracement waves of 2 and 4 tend to have 3 constituent waves.
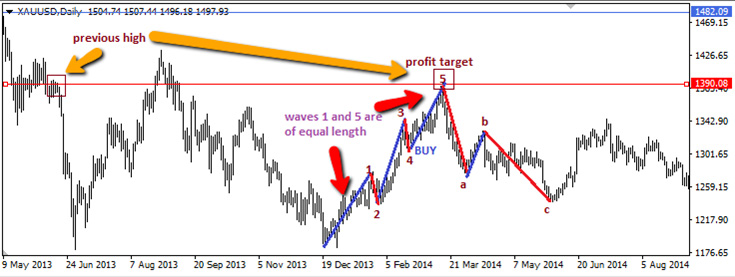
1) Wave 3 tends to be the longest of the continuation waves in the impulse wave component of the pattern. If this is case wave 5 and wave 1 tend to have equal lengths. If the trader enters a position at the start of the 5th wave, the trader should be able to calculate the length of wave 1 and use this to make a measured move from the commencement of wave 5 into the future. The end point is now set as the profit target. This works in an uptrend or downtrend, and confirmation can be used using a trendline to spot previous highs or lows around the same area where the profit target is set.
2) Waves 2 and 4 work in alternation between steepness and flatness. What this means is that when wave 2 is a steep correction, that of wave 4 tends to be flatter. When the wave 2 correction is flat, the wave 4 correction is usually steeper.
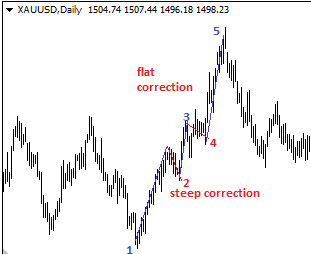
So when looking to setup a trade at the start of wave 5, do not expect to see a steep correction of the wave 2 pattern already displayed this: you may miss the trade opportunity.
3) The a-b-c corrective wave sequence usually terminates at the same level where the wave 4 retracement ends. So a short trade that is executed at the end of wave 5 to follow this a-b-c sequence should be exited where the wave 4 correction ends.


