Thanks to the evolution of charting packages and trading platforms, technical analysis has become one of the most popular approaches to trading. Unlike fundamental analysis, which implies that economic and financial factors are the best indicators of an asset’s supply and demand, technical analysis is based on the idea that future market trends can be forecasted by interpreting past and present performance.
Traders who rely on technical analysis use historical charts and statistical trends to spot price changes and identify the next big trading opportunity. Although this discipline works on all securities that have historical trading data, technical analysis is often popular in Forex markets because traders typically focus on short-term price movements.
Today, technical analysis involves hundreds of tools that have been developed over years of extensive research, but its history starts in 1885, when Charles Dow, the founder of the Wall Street Journal, created the Dow Jones Industrial Index, where he recorded his highs and lows, linking them to certain events on the market. He would also write articles about past market events, explaining how they could have been predicted by analyzing patterns.
The first historic proponent of Dow Theory, William P. Hamilton, used the measures suggested by Charles Dow, plus a few other rules, to forecast bullish and bearish market trends and even gave a final warning three days before the 1929 crash. Later on, Robert Rhea used Dow’s methods to predict the 1932 market crash and its 1937 recovery. He also wrote a book, The Dow Theory, which popularized Charles Dow’s discipline and is now on the bookshelf of every technical analyst.
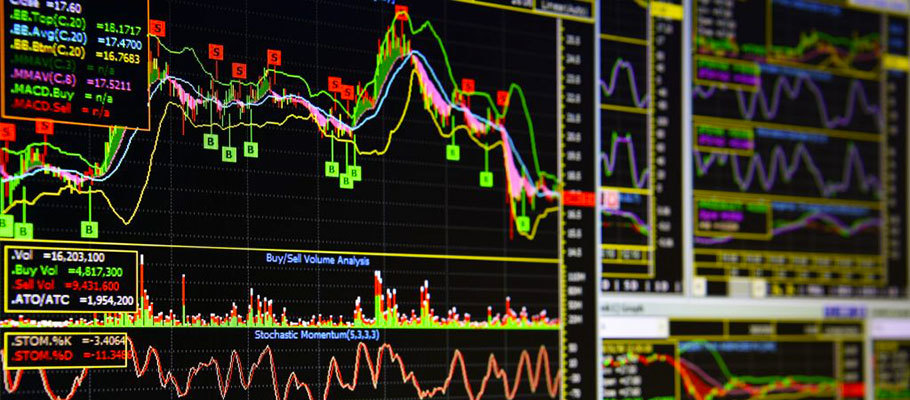
Technical analysis means interpreting historic data patterns from charts to identify trading opportunities or, on the contrary, avoid a risky move. The most common types of technical analysis charts are line charts, bar charts, and candlestick charts.
There are three main principles behind technical analysis:
This principle suggests that traders only need to analyze price movements, which are the result of supply and demand. All information, from inflation to interest-rate data and market psychology, is already included in the asset price. Even “unknowable” factors, such as natural disasters, are discounted in the form of risk. In other words, the trader doesn’t need to consider all these factors separately, because they’re already included in the price movements.
Technical trading strategies are based on the idea that prices are unlikely to move erratically and instead, they follow short, middle, and long-term trends:
This principle is in many ways similar to Newton’s first law of motion: objects will remain in their state of motion unless a force acts to change the motion. Forex traders who follow this principle catch rising market trends early on and then ride these trends until the market shows signs of reversing.
Looking at chart patterns, one might be tempted to assume that technical analysis has nothing to do with human psychology, but technical analysis is actually based on human psychology, which has a tendency to repeat itself. Propelled by emotions such as fear or excitement, market psychology causes price movements to repeat themselves and even the oldest technical analysis tools, which have been used for more than 100 years, are still relevant because of this. In spite of the economic, social, and political climate, human psychology is repetitive, and by looking at historical charts, a seasoned trader can spot these patterns and act accordingly.
Risk management is a common concern among beginner Forex traders, who often feel like their successes are guided more by luck or expert tips, and that they have no way of knowing how the market will fluctuate. In reality, risk can be greatly reduced by understanding the market’s patterns – which is where technical analysis comes in.
Although this discipline alone may not always be enough, and each trader has their own style, technical analysis does offer some key benefits:
That’s not to say that technical analysis in the Forex market doesn’t have its limitations. It does, and many times it’s wiser to combine it with fundamental analysis.
For a beginner, technical analysis can come across as challenging, but once you grasp the basics, you can use it anywhere. Candlestick analysis, in particular, is very useful because you can use it to forecast the future direction of the price.
In a time where traders can receive real-time market updates via push notifications or let themselves swayed by any viral tweet made by an influential figure, technical analysis can help them trade in a more controlled manner, based on historical data, not rumors and hype. Besides, compared to fundamental analysis, technical analysis is much more affordable, with some companies even providing free charting software.


