
Harmonic patterns are a set of patterns which are based on the Fibonacci ratio, and are composed of 5 price points: X, A, B, C and D. X marks the commencement point of the pattern and D marks the completion point. Depending on the shape of the pattern, the trader can use the pattern to predict the ultimate direction the price will assume from point D.
The Fibonacci ratios allow the trader to measure the distances from one point to the other, and therefore predict price direction with a high level of accuracy. It is not enough to simply know the expected direction. Entries must be made properly, and exit points defined.
Most of the harmonic patterns shows a price reversal from the price wave that runs from point C to D. In other words, price is expected to reverse from point D. However, it is also possible for price to continue beyond the expected location of point D. In this instance, you can use the Fibonacci ratios to predict the future price points.
Each point is a certain Fibonacci ratio of another point. Therefore, you can use the Fibonacci ratios to determine point C from point A, or point D from point B, etc. It is a question of deriving the retracement and extension ratios from any of the reference points.
The Fibonacci ratios commonly used are the retracement ratios of 23.6%. 38.2%, 50%, 61.8%, 78.6%, 88.2% and 100%. The Fibonacci extension ratios start from 100.0% and extend towards the 127.2%, 141.4% 161.8%, 200.0%, and so on.
Each harmonic pattern has a bullish (M-shaped) and bearish (W-shaped) variety. The commonly traded harmonic patterns are:
The position of point D relative to the XA wave is what tells each of these harmonic patterns apart. Here is a description of each pattern.
First described by H.M. Gartley in 1935, the M and W Gartley patterns are described as follows.
Price reverses from Point D in a direction opposite to the CD wave. Entry confirmation is done using a candlestick pattern or a support/resistance based entry.
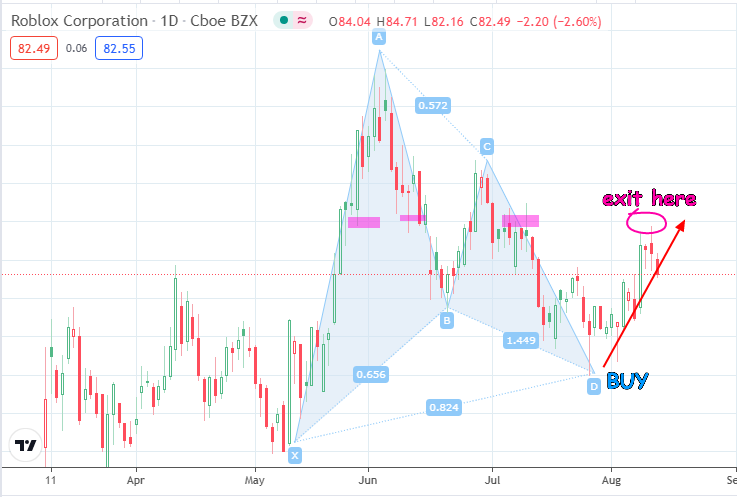
Bullish Gartley Setup
The chart shows a bullish Gartley pattern (M pattern), with point D marked by a rejection that ended up forming a hammer candle. This candle and subsequent ones bounce off support , which is where the BUY entry is made for the trade. Exit point is at the purple coloured area where the price had formed a previous resistance. Notice that the third purple coloured area showed where several candles formed upper shadows, indicating price rejection.
The W Gartley pattern is a bearish pattern and follow the same principles as the M Gartley pattern, acting in a reverse fashion.
Ever seen a bat with its wings spread out? That is how this harmonic pattern got its name.
See the bat pattern below:
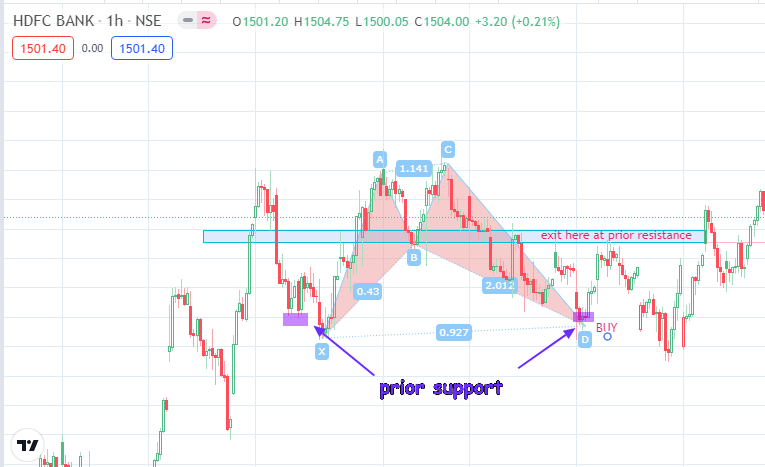
Bullish Bat Pattern
Here, we see the BUY entry point coming at a previous support. Also, there were at least two pinbar candles (not very visible), which pointed to the trade entry confirmation. The price target was the previous resistance zone.
The butterfly pattern differs from the Gartley in having point D located beyond point X. This means point D is higher than X in the bearish version, and lower than X in a bullish version of the pattern.
This is more difficult to trade, unlike the other harmonics where the failure of the D point to hit the same high as point X (bearish) or the same low as point X (bullish) points to a stall in the trend.
In the snapshot below, the bearish engulfing candlestick pattern at point D was the confirmation for the trade.
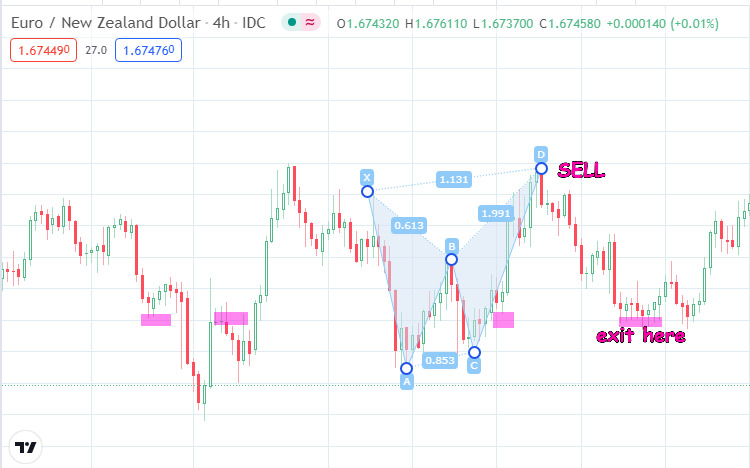
Bearish Butterfly Pattern
The crab resembles the butterfly pattern in having a point D which exceeds the limits of point X. However, the difference lies in the positioning of the other points as defined by the Fibonacci ratios.
The end point is for the trader to be able to setup a long position on point D, using a prior resistance as a possible exit point with the stop loss set a few pips below the entry point.

Bullish Crab Setup
Here, we can see that the trade was setup by the reversal from point D, with the exit from the long trade set at the previous resistance. Notice the shape of the pattern, which gets its name from resembling the pincers of a crab.
In conclusion, note the following:
– The Gartley patterns and the Bat pattern are the only two harmonics where point D does not extend to the limit of point X, indicating a progressive failure of the trend in that direction.
– The Butterfly and the Crab patterns are the only harmonic patterns where point D exceeds the limit of point X. This makes it imperative to rely on reversal candlestick patterns or divergence from oscillators to detect point D. As such, these patterns are riskier to trade.
– Always seek confirmation for trade entry and exits.


