
Various precious metals are traded on online platforms, but the most popular are gold and silver. Both have been used in various times in history as means of exchange or as a store of wealth. In modern times, silver has found other uses in the pharmaceutical industry (silver nitrate) and in industry (e.g. components of smartphones).
Gold and silver can be traded as Contracts-for-Difference assets, in which case the trader can track and trade the price movements of both metals without owning the underlying assets themselves.
The peculiarities of the trading process for each precious metal are known as the contract specifications. If you trade gold or silver as CFDs on an online platform, these are the feature you will expect to encounter.
a) Symbols
Gold and silver are traded as pairings with fiat currencies, particularly the US Dollar. The symbols for both metals are derived from the first two letters of their Latin names: Aurum for gold and Argentum for silver. So the symbols are XAU for gold, and XAG for silver. The pairing of both assets with the US Dollar is represented as XAU/USD and XAG/USD.
b) Trading Hours
Gold, silver and other precious metals are commodities. The commodity markets are traded from Monday to Friday, with a one hour break period each day. So you will be able to trade gold and silver 2200 hours UTC to 2100 UTC each day, with the break occurring between 2100 UTC and 2200 UTC. You will be unable to place or amend orders during the break period.
c) Contract Duration
Contracts on gold and silver do not expire, so there will be no automatic settlement and rollover of any open contracts on expiration day as is the case with other commodities such as crude oil or agricultural commodities.
d) Margin
The new rules on margin requirements for trading as set by the European Securities and Markets Authority (ESMA) have altered the trading landscape in Europe. If you are trading with a European broker, you will trade with increased margin requirements. Leverage for trading of gold on European brokerages has been reduced to 20:1, which means that margin requirements have been raised to 5%. In other words, where you needed $100 to setup a mini-lot position to trade gold or silver, you will now need $500 to do so.
Brokerages with divisions outside Europe and the UK now offer their clients the opportunity to be migrated to divisions that still offer leverage of 100:1 or 200:1.
e) Trading Conditions
Trading gold and silver requires an understanding of the fundamentals behind price movements, as well as ability to read the charts to determine proper entry and exit areas.
Gold prices tend to respond most to political/economic stress or crises, the value of the US Dollar (with which gold shares an inverse relationship), interest rate policies of central banks and inflation (which also determines interest rates). In contrast, silver has more of an industrial usage and so has very different fundamentals.
Gold is generally a safe haven investment which sees greater demand when there is a risk-off sentiment in the financial markets. Gold buying increases when market sentiment shifts to capital preservation. Gold saw some of its best bullish runs in the worst years of the European sovereign debt crisis and the years following the sovereign debt crises in Greece, Spain and Ireland.
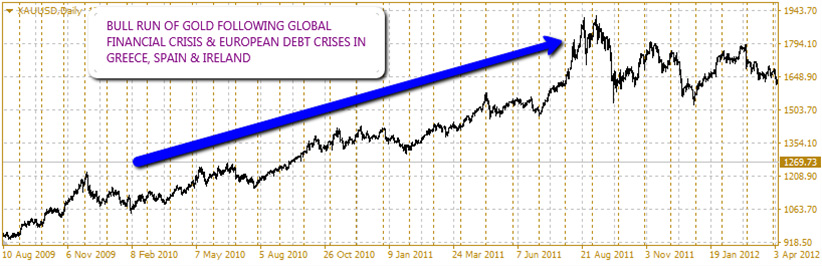
Gold prices peaked in 2011 as European Sovereign Debt Crises Kicked In
Central bank monetary policy is usually centred on control of inflation using interest rates. There is an inverse relationship between interest rates and gold prices. Higher interest rates affect the returns of investment in fixed income vehicles such as treasury bills. Higher interest rates lead to a “risk-on” sentiment, which leads investment capital to seek riskier assets in the hope of getting returns. So traders and investors will exit gold positions to take on these positions. We see this situation following years of quantitative easing, as bets for interest rate increases went up.
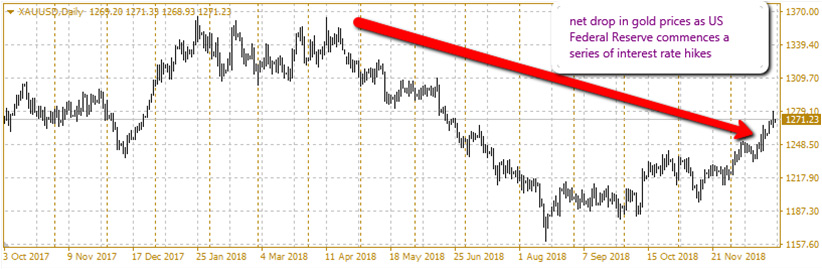
Gold prices and interest rates: prices drop as US Fed Reserve Raises Rates
Gold is paired against the US Dollar, which sees the two assets in an inverse relationship. A stronger dollar (which is also consequence of interest rate hikes among other factors), will lead to weaker gold prices and vice versa.
Silver’s fundamentals are tied towards the state of the industries where it is used. Silver demand stems from industrial use (e.g. photovoltaic cells, smartphones, electrical cars), jewelry, minting of coins and other silverware. Demand from US, China and India is an important fundamental factor for silver.
You can trade gold directly as CFD assets on an online platform, or you may trade them indirectly by either trading stocks of companies that mine gold or silver, or trading exchange traded funds that have a high component of gold or silver in their weighting.
Here, we advocate direct trading of either the XAU/USD or XAG/USD asset. This demands a good knowledge of the fundamentals of gold and silver prices. It also depends on a sound knowledge of how to make technical entries and exits. The chart below for silver shows various patterns that have formed from 2017 till date. These patterns would have pointed to the trader exactly where price was headed.
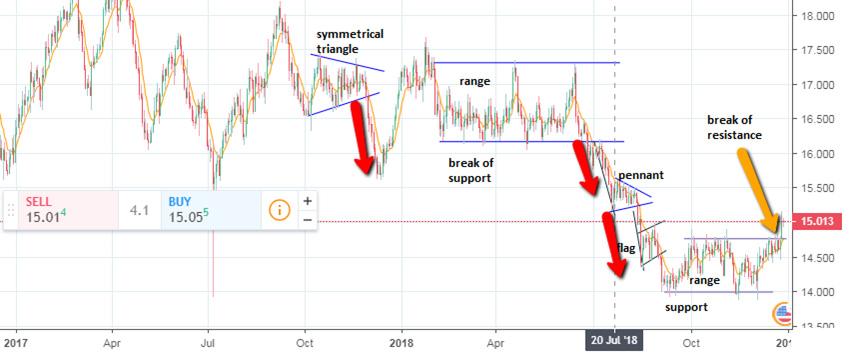
Daily Chart for XAG/USD
First, we see price action breaking downwards from a symmetrical triangle, followed by an area of price consolidation/range trading. A break of the support line that formed the floor of the range was followed by a move south, which formed the pole for a bearish pennant pattern. The pennant is a continuation pattern, and price expectedly broke south in continuation from the bearish pennant. This also formed the flag pole for the bear flag, which also resolved in a downward move to the $14 price area. Price then oscillated between the $14 area acting as support, and the $14.76 area acting as resistance. Price has broken above the resistance in an upside breakout move.
Also note the orange-coloured 9-EMA line which acts as dynamic support and resistance for price moves. Notice how the 9EMA was acting as support for price within the area of consolidation before the latest breakout.
Following patterns on charts is a good way to gauge possible direction of price moves. Once you have a direction, the other factors to put into use are:
Gold and silver prices respond well to the use of technical analysis, but only when the overall direction of the market has been detected using the fundamentals.


