
Many traders are bereft of ideas on how to set their profit targets for trades they take in the forex market. The end result is misplacement of their Take Profit targets. Usually, they end up setting very ambitious targets, and the price will end up hitting the right spot and retracing on their position while leaving their TP in the wilderness. This is why all forex traders on the retail end of the market need to understand the concept of measured moves, otherwise known as the price projections or the swing measurements.
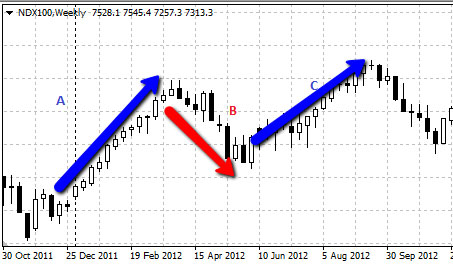
A measured move is an action of price in which major price advances and declines can be divided into equal parts. Newton’s 3rd law of motion states that “action and reaction are equal and opposite to each other”. The implication of this is that where there is a reactionary dip in an uptrend or a reactionary rally in a downtrend, the next phase of the price action which continues the initial trend will run the same distance as the first half of the trend move that preceded the dip or rally. Notice how the uptrend moves A and C are almost equidistant in the context of this one-year move.
As the name implies, the “move” is measured. The “move” here refers to the following price actions:
A) Price breaking out from patterns such as the triangles, rectangles and wedges.
B) Price continuations from patterns such as the flags and pennants.
C) Price reversals that occur from topping or bottoming patterns such as the head and shoulders pattern and the inverse variety of this pattern.
D) Price continuation in the initial trend following a period of retracement.
The example of a measured move shown above is an uptrend > retracement dip > uptrend resumption sequence, which is highlighted in point (d) above. In this instance, the retracement move (wave B) usually dips to about a 1/3 or 1/2 of the initial wave A, and then resumes from the end of wave B to end at a point that is the same (or almost the same) distance as the initial uptrend wave A. In other words, wave C should be a near duplicate of wave A.
To setup a trade using the measured move principle, the entry will be made at the termination of the countertrend wave B, and the TP will be set using the distance from the lowest point of the retracement dip and into the future upwards (since the trend is an uptrend and a long trade is going to be used to chase this).
Measured moves in an uptrend
Properly deriving the measured move in a trend setup is dependent on being able to calculate the relevant key areas. These key areas are:
A) The length of the initial trend move
B) End of the retracement/countertrend wave
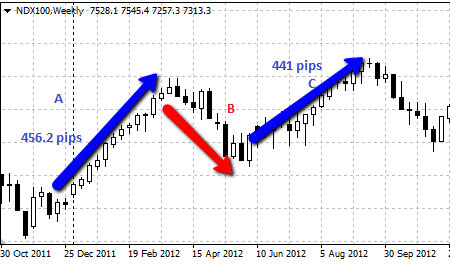
In this trend move that lasted from October 2011 to August 2012, we can see the initial uptrend move which was measured to be 456.2 pips. How was this derived? This was derived by subtracting the price at which the move commenced (start of the initial trend wave) from the peak of wave A. In other words, subtract the bottom of wave A from the top of wave A.
The counter trend is usually 1/3 or 1/2 of the initial trend move. In some cases, it may even extend to 2/3rds of the wave. Simply multiply the length of the wave A by the fraction. Then subtract this figure (in points) from the price that corresponds to the top of the wave A. This gives the point at which the countertrend wave will possibly stop before the next wave (the measured move) continues.
To demonstrate, wave A of the Nasdaq 100 (NDX) kicked off at
The price levels for a reaction low from the countertrend wave are derived by subtracting these values from the top of wave A, putting the possible reaction lows at 2614.77, 2538.75 and 2462.2.
Price retraced eventually to 2457.1, which was about 2/3rds retracement. The measured move is completed by adding 456.1 points (length of wave A) to the reaction low of 2457.1, which gives us a TP of 2913.2 points. So when setting up the long trade at the reaction low, you set the profit target at or around 2913.2 points. Some traders would prefer to use the psychological resistance at 2900, which will still deliver profits. The move eventually peaked at 2,898.1 points, close to the psychological support of 2,900 points.
The measured move in a flag takes into cognizance the distance between the start of the initial trend move preceding the pattern (the flagpole) and the time the flag develops. This distance is extended from the breakout point and projected into the future, in the breakout direction.
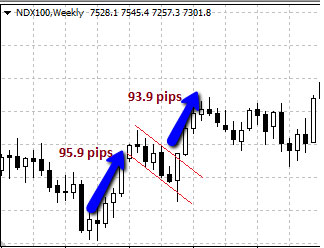
Measured moves in a flag pattern
A similar picture is seen with the pennant pattern. In this snapshot below, we see the bearish pennant showing similar projected moves from the initial downtrend, as price broke below the lower border to complete the measured move which is equidistant to the pole move. Keep an eye on where price has formed support following the end of the measured move.
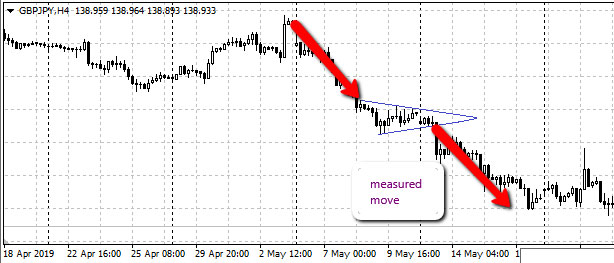
Measured moves in a pennant pattern
Deriving the measured move in a flag or pattern is easier, as the boundaries of the pattern provide the basis for the trade entry. The boundaries also make it easier to measure the length of the initial move.
There are three triangle patterns, and the approach to the measured move is the same in all patterns. With patterns, what matters is not the length of the initial trend but rather, the height of the triangle base. The base of the triangles is formed by the vertical distance of the commencement points of the trendlines that form the triangle borders.
It is important to note that the trace of the triangle borders is not started from an empty space. The traces must commence at the 1st price highs and lows that constitute the commencement points for the trendlines. The trendlines must also form borders that have touched at least two highs and lows on their way to converging at the apex.
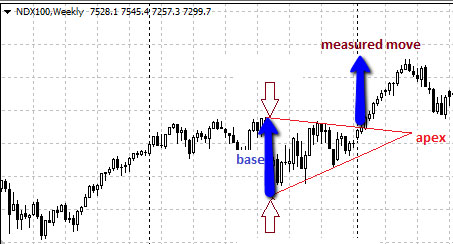
Measured moves in a symmetrical triangle
The symmetrical triangle above captures the measured move from the breakout perfectly. You can also see the same setup in the ascending triangle bottom pattern below, where the base was perfectly extrapolated into the future from the breakout point to provide a sound basis for trade exit.
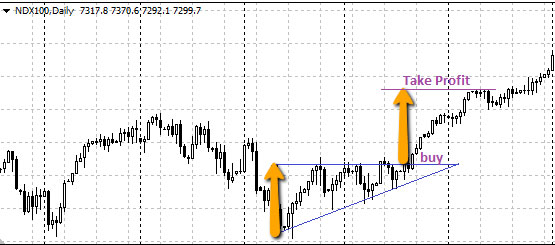
Measured moves in an ascending triangle pattern
Deriving the measured move in a flag or pattern is easier, as the boundaries of the pattern provide the basis for the trade entry. The boundaries also make it easier to measure the length of the initial move.


