Support and resistance can be defined by a number of tools in forex, and one of those tools is the component of the Ichimoku Kinko Hyo indicator known as the Kumo or Cloud. The Ichimoku indicator tends to scare a lot of traders because it looks confusing. However, having a perfect understanding of how it works allows the trader to use the various components to good effect.
The Ichimoku indicator has various components. It is not usually necessary to use all 5 or 6 components at once. The Kumo for instance, can be used alone to trade currency pairs using its inherent properties as a support/resistance indicator.
To better understand how to use the Kumo as a support/resistance indicator, it is important to understand the key elements of support and resistance trading. One of these elements is the role reversal element.
– Role reversal is the switching of roles of a support or resistance point in rejecting a pullback or return move of price action after price has broken through this key level. It states that once a key price level has been broken, the function of that level changes. So a broken support level becomes a new resistance level, while a broken resistance becomes a new support.
– We must also remember the second element, which is the fact that repeated tests of a key area of support or resistance which do not break these areas tend to make them stronger. It will then require more force of pressure from traders to break these areas.
Grasping these principles of support/resistance trading will enable the trader have a better understanding of how to use the Kumo for support and resistance trading.
The shape of the Kumo will give an indication of how strong it will be in determining support and resistance. So how can you use the shape of the Kumo in this regard?
The Kumo is bounded by two lines known as the Senkou span lines A and B. These delineate the Kumo and make it easy to distinguish from the rest of the chart or Ichimoku indicator. The Kumo can be seen to either be flat, or bulky. So you have to check to see whether the Kumo is flat or not, and if the Kumo is forming a top or a bottom.
After identifying the flat tops or bottoms, you can use the trend line drawing tool on your platform to trace a line across the Senkou span A (for flat top) or Senkou span B (for flat bottom) respectively.
A proper trace enables the trader to detect in an instant where price is bouncing off a support or where price is being rejected at a resistance. This time, the support and resistance has been delineated by the borders of the Kumo. This action also tells the trader when price is in role reversal mode, so that precise entries using limit orders can be made. The chart below demonstrates how to use trendlines to delineate the support/resistance areas on the chart, tracing these across the borders of the Kumo.
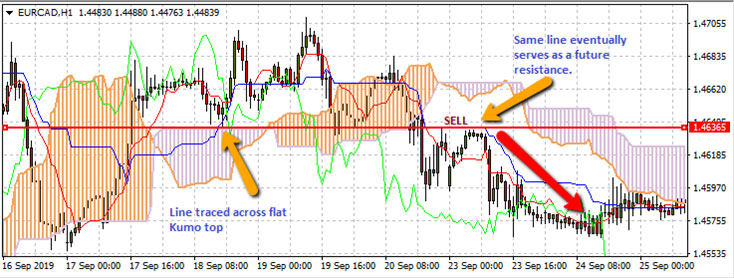
EURCAD 1 hour Chart Showing Kumo In Role Reversal Setup
The chart above is a EURCAD hourly chart that spans a 2-week trading period. Here, identification of the Kumo flat border was the first step. In this instance, the grey Kumo area (Down Kumo) showed a flat top, on which the red trendline was then drawn horizontally using the trend line tool. In this example, the Kumo top was acting as a price support, shown as the bounce of the price candles and eventual upside price move of these candles.
The next step is to allow price action to evolve, in order to use the same trendline in future to either trade another support bounce if the Kumo top trendline were to hold, or to use the trendline to trade as a resistance if role reversal has occurred.
In this case, the role reversal occurred because price activity had broken to the downside sometime around September 20. Price made a pullback in an upward direction, but was rejected firmly on September 23, providing an opportunity to initiate a SELL trade to follow price to the downside.
In the example below, the Kumo bottom is shown acting in its original capacity as a support area. Here, role reversal did not occur.
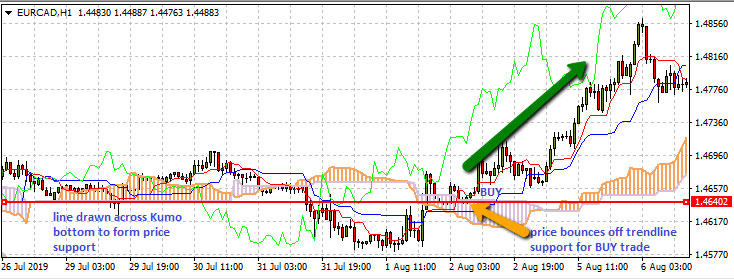
EURCAD 1 hour Chart Showing the Kumo As a Support Tool
The trendline was traced on a flat Kumo bottom on July 29, forming a support area. This area did not become relevant until August 2, after a series of break actions by price in crossing this trendline several times. It was on August 2 that the price now bounced once more on the previously drawn trendline to form a support for renewed uptick of price action.
Being able to tell when price will bounce off support/resistance in its original function, or break through the trendline and act in role reversal is very important in trading this setup successfully.
The principle of the breakout is what is used. For price to be deemed to have broken a support/resistance area, the price bar/candles must have closed beyond that area by the use of a price filter or a time filter.
In technical analysis, the time filter used is a double candle close. This means that price must close below a support or above a resistance with 2 successive candles before a price breakout is deemed to have occurred.
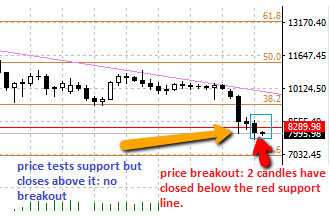
The second breakout confirmation tool is the price filter. This states that the candle that closes below the support or above the resistance to produce a breakout must close with a 3% penetration (long term charts), or with a 1% penetration (short term charts). What do the 1% and 3% penetrations mean and how are they calculated?
Let’s take the 3% penetration factor. This percentage refers to the extent of the price move beyond the support or resistance point, expressed as a percentage of the length of the candle. Using the same chart just shown, we see that the candle that broke the red support line closed at a price of 8073.50. The candle high was at 8625.90. The entire candle move from the high to the closing price is calculated as 8625.9 – 8073.5 = 552.4.
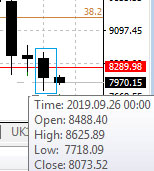
The support line is located at 8289.98. The distance between the support line and closing price is 8289.98 – 8073.5 = 216.48. Therefore, the penetration percentage is calculated as follows:
[216.48/552.4] X 100% = 39%
This means that the penetration of the breakout candle was 39%, which more than satisfies the 3% penetration requirement on the long-term chart used.
This is how to determine a breakout, so that you know when to trade a bounce situation on the Kumo top/bottom, or a breakout > role reversal situation.


