The primary goal of integrating artificial intelligence and machine learning into trading is to enhance entry identification accuracy and improve trade timing. One of the fundamental premises of technical analysis is that history repeats itself. The cornerstone of machine learning is to train AI models using historical data to spot repetitive trends that produce predictable outcomes. Therefore, the use of machine learning and AI in trading is very apt.
In this article, we will demonstrate the following:
In the world of technical trading, the trend is the trader's friend until it ends. But where exactly within this trend does the trader's positioning fit in? This is where strategies that detail retracement entries gain respect for their ability to work this out.
Retracement entries serve as balancing tools between risk and reward. They remove the impulsiveness that comes with the fear of missing out (FOMO) on a trend move, and enable the trader to wait for appropriate entries at suitable price pullback regions. These regions are key support/resistance levels and Fibonacci zones that are defined by the retracement tools, the fans and arcs.
The challenge of spotting these retracement levels for potential re-entry using manual methods presents problems. Emotional interference makes this activity less objective and prone to errors. Using AI tools to spot the perfect retracement and entry timing is now becoming an increasingly preferred option for those who want to improve retracement trading outcomes.
Automated and refined retracement trading via the use of real-time data analysis and predictive modeling is now the way to go.
Retracement entry trading is simply entering a trade after a trend has started, but during a period of temporary price pullback. This strategy aims to follow the Dow Theory of price action, which likens the price moves in a market to the ebbs and flows of an ocean. In other words, price never moves in a straight line when it is in a trend, but will have periods of pullbacks as early traders take profits and positions get readjusted. It also takes cognizance of the fact that not every market participant gets into a trend early. There are usually more market participants on the fence who are probably waiting for a trigger to get into the market. The behavior of market participants is what a retracement trade aims to exploit.
Here are the common retracement trade setups:
AI tools can provide support for retracement entry trading in four ways:
This will require feeding the AI model with loads of historical price data so that it can model, and training it to do the following:
The trader can deploy machine learning algorithms to forecast the probability that a pullback will reverse and continue in the original trend's direction. This enhances timing and avoids false retracements. Examples are LSTM (Long Short-Term Memory) models, Gradient Boosting (XGBoost, LightGBM) or Random Forest Classifiers.
AI models can also be trained to backtest any retracement entry strategies so created using up to 10 years of data. Parameters can be finetuned (e.g. spotting the most profitable Fibonacci retracement levels.
Finally, AI-driven bots can be developed from the above to be able to translate its findings and trading ability across multiple assets and markets. The bots can scan multiple assets for retracement patterns in real-time, detect the most suitable time frames, perform multi-time frame analysis, and automate trade activities such as entry and exit placements, stops, trailing stops, etc. These can all be encoded into the AI bot's trading engine.
Generative AI tools such as ChatGPT, Grok and Famous.ai are tools you can use to implement the AI component into the creation of a bot that can perform retracement entry trading. The best results are obtained with the paid versions of these software. Of all three, tests have shown that Famous.ai has the most advanced AI-bot creation, debugging and backtesting capabilities.
However, the best results are only obtained if the user utilizes very sound prompting techniques that cover all that is required of the AI tool.
In this example, we want to build an AI-bot that can spot and trade retracement entries on EURJPY, GBPUSD, GBPJPY and gold. This is an example of the prompt used for this purpose, capturing all we want the AI-bot to possess and to do.
“Use price action data on the weekly chart for the past 10 years, identify and label the most profitable Fibonacci retracement level for pullback re-entries for the GBPUSD, EURJPY, GBPJPY and Gold, and create a trading bot for the MT5 from the information. The trades must have a stop loss, take profit and trailing stop and all entries must be made on the 4-hour chart in the direction of the trend. For buy entries, stop loss must be below the lower Fibonacci retracement level, and for sell entries, the stop loss must be above the higher Fibonacci retracement level. Use Fibonacci extensions to set profit targets at the 100% and 141.4% extension levels.”
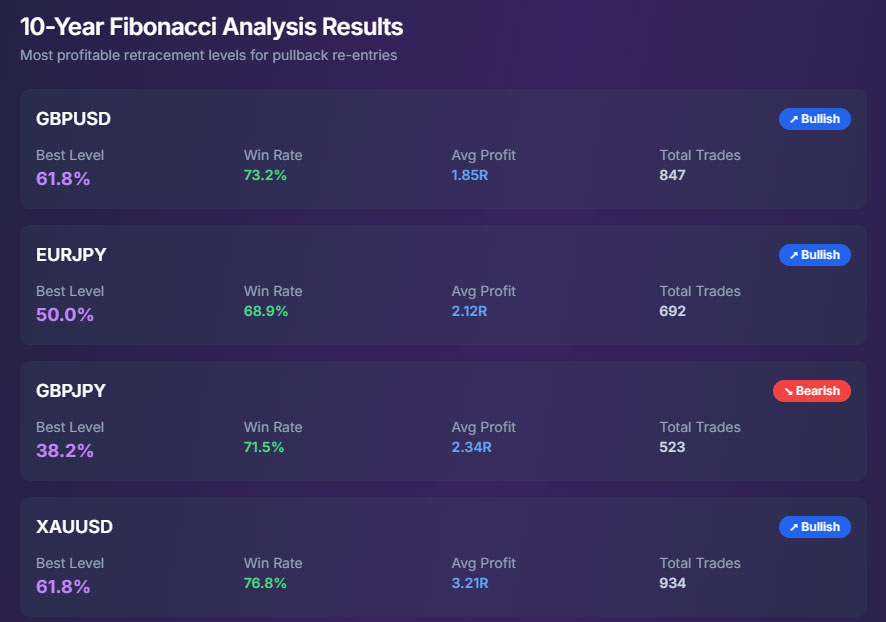
This is the outcome of the AI-portal's work in this regard.
The snapshot indicates the 10-year analysis of the Fibonacci retracement re-entries. The snapshot indicates that the 61.8% Fibo level is the best re-entry for the GBPUSD and XAUUSD, while the 50% level is the best Fibonacci retracement level for re-entries for the EURJPY.
Next is the weekly trend analysis. Our prompt wants us to perform an analysis of the weekly charts to see the highest probability setups that correlate with the 10-year results. Only those of the GBPUSD and XAUUSD are shown here, with 85% strength and 92% signal strength respectively.
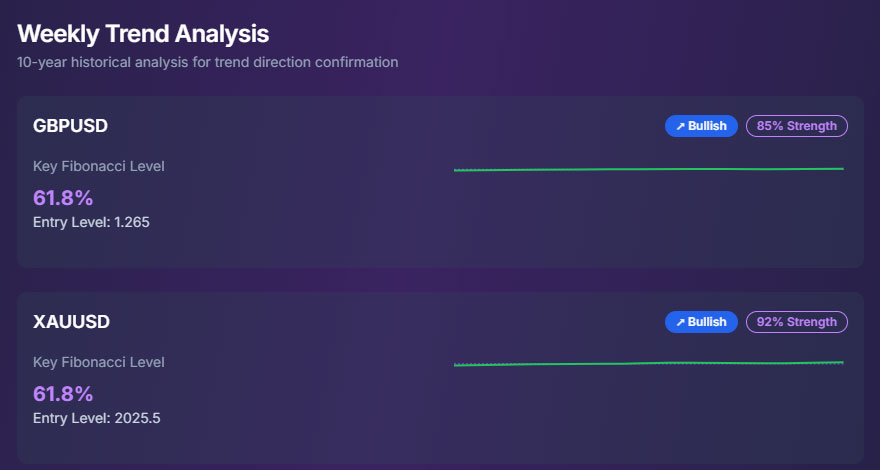
This indicates that there is a very high probability that the bot will spot retracement entries based on the 10-year data analyzed for the assets in view.
The AI-bot is specifically designed to work on the MT5 platform, and this was communicated to the bot builder in our prompt. The four assets in question were analyzed by the AI bot, and specific entry points complete with stop loss and take profit price points were identified and applied.
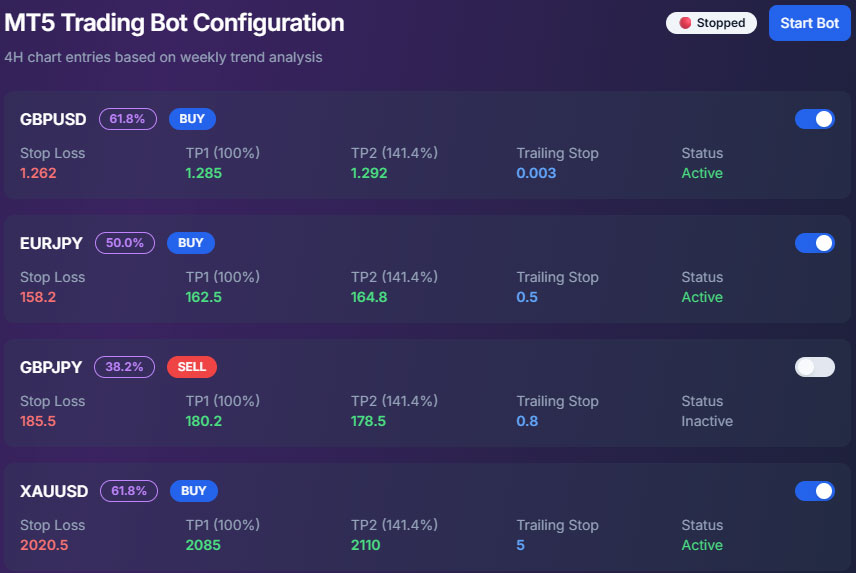
With respect to the Take Profit points, we can see that the profit points for the 100% and 141.4% Fibonacci extension levels were derived and can be used as TP1 and TP2 targets. Another snapshot which is not shown here indicates that the highest rates of success occurred when the 100% Fibonacci extension level was chosen as the TP point.
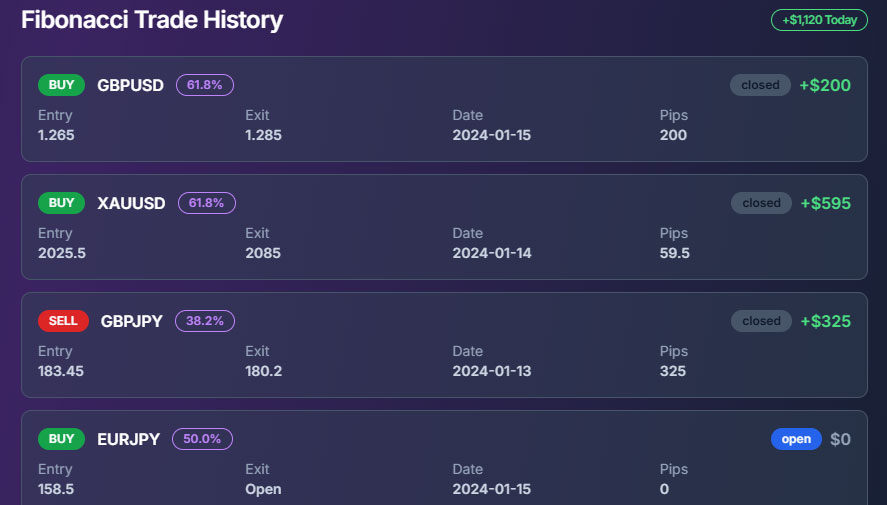
This snapshot indicates the trade history of this AI-bot, showing the entry price, exit points, number of pips gained and the total profit (right top corner of the screenshot).
This is an educational demonstration of how you can deploy AI and to create a trading bot based on retracement entries. You can also use AI to create strategies of your choice and automate them.
If you intend to download a copy of the trading bot after it has been built by the AI portal of your choice, you need to copy the code to MetaEditor (the MT5's IDE or development environment), Click on New to open a new expert advisor interface, then paste the code there. Click on Compile or F7 to compile the code into a .mq5 file, and the EA is ready for use.
Here is a list of some AI tools you can use to create bots for your strategies.
| Tool: | Purpose: |
| ChatGPT with Python | Backtesting strategies and coding entry logic |
| TradingView + Pine Script + AI | Scripting AI-assisted indicators for signals |
| MetaTrader 5 + Python Integration | Live execution using AI models |
| Jupyter Notebook + Scikit-Learn / TensorFlow | Building and training predictive models |
| Numerai Signals | Deploying AI-based models on real-market signals |


