
Every cryptocurrency trader's dream is to catch that substantial bullish candle on the charts, especially when a coin has been recently listed. Who would not love the big moves that translate into moves of 100%, 200% or even 1,000% in a matter of hours or a few days?
After a long search, the writer stumbled on some information that could make this quest a reality. It is possible to position yourself into a stock that will make some big moves with some careful application. Even if the initial big move is not caught, subsequent retracement moves can produce some heavy returns. Here is how to detect a coin that has the potential to pump hard.
The first step is to search for the exchanges with coins that have the potential to pump. The source for this information is the CoinGecko website. On CoinGecko, search for the exchange you want to use. Click the search box below the CoinGecko logo. This action throws up several exchanges where these coins may be found. Let us assume that we want to search the Binance exchange.
Let us use the example of the Binance exchange. Click on "Exchange", and on the drop-down menu, click on "Spot". This displays the list of exchanges that can be searched for potential big winners. So click "Binance" at the top of the list. Once the exchange is selected, it displays the coins that have started to attract massive volume. Scroll down the list to search for pairs that are not popular, do not have a lot of market attention, but have started attracting enormous volume.
The table on CoinGecko displays information about these assets such as price, the spread, volume % increase or decrease, 24-hour volume and the Trust score. The information that is of interest to us is the 24-hour volume for the coin pair.
What you need is to select:
In other words, you should be looking for a coin with a large trading volume which is about half to a quarter of the market capitalization of the asset.
For this example, we have been able to identify one of such coins, which is Aragon (ANT/USDT). Aragon has a 24-hour trade volume of $111,872,474 (September 2, 2021), one-third of its total market capitalization. This means that there is institutional demand on the asset, and there is a lot of asset accumulation.
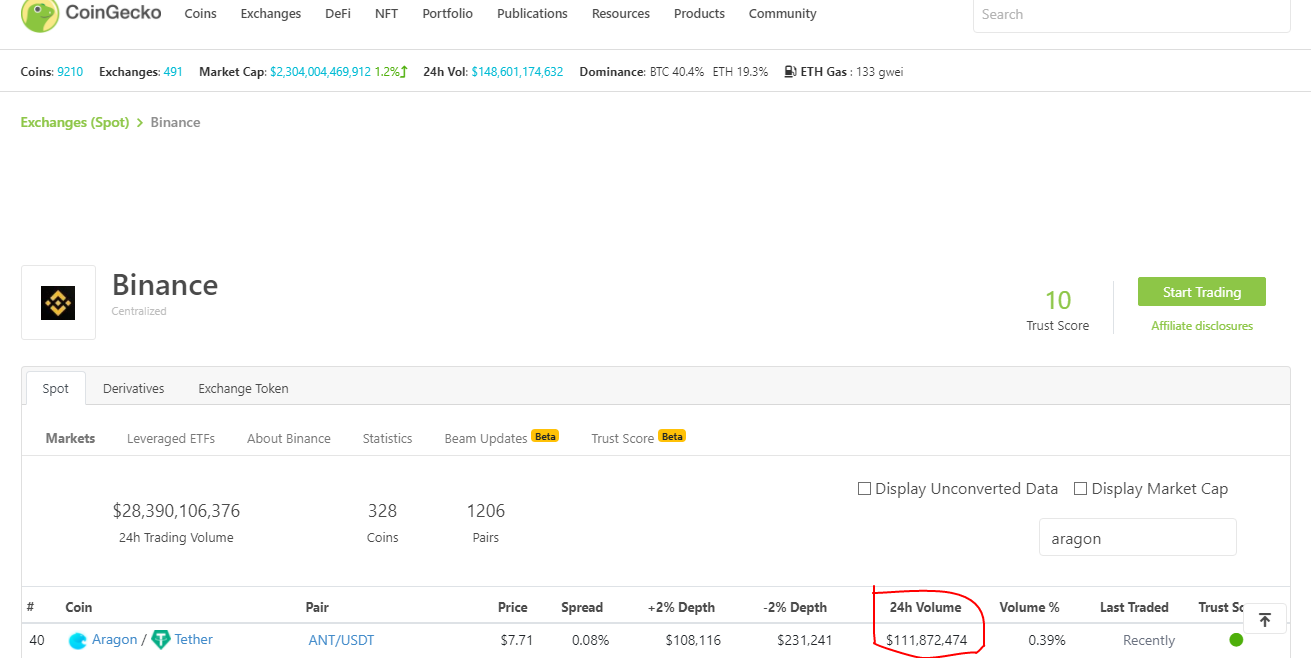
Aragon’s 24-hr Trade Volume: $111,872,444 (September 2, 2021)
You can also click against the pair’s icon, under the “Coin” section, to get a view of the market capitalization as shown below.
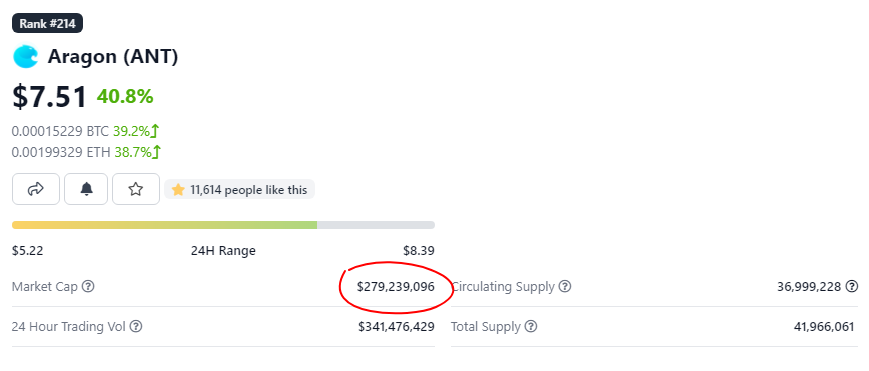
Aragon’s Market Cap: $341,476,429 (September 2, 2021)
Once you have identified a coin like Aragon that fits these parameters, you have to implement a trading technique to get in early. You do not want to get in at the end of the move, but sometime in the early part. That way, the spike can carry you into profit.
Head over to the Tradingview chart or any other chart of the crypto exchange you are trading with. Most of them use Tradingview anyway. Open the daily chart and identify previous support and resistance areas, as shown below.

ARAGON (ANT/USDT): Daily Chart
The support and resistance levels provide you with entry and exit points. Once you have identified the support and resistance levels on the daily chart, head over to the 15-minute chart. This is the chart where you will perform your trade entry.
Apply the volume indicator to the 15-minute chart. You want to identify the candles where there was a large injection of trade volume on the buying side, shown as a long, green volume bar.
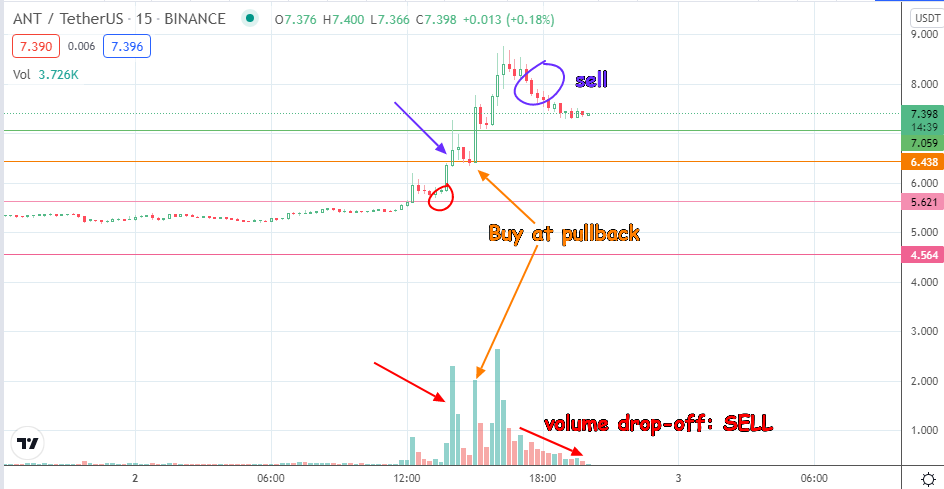
ARAGON (ANT/USDT): M15 Chart
The aim is to buy at a support level when at least one spurt of buying volume hits the asset. On the 15-minute chart above, we can see buying spurt occurring at just beyond 5.621, where the red circle is. The buying pressure was able to break the resistance at 6.438. The 6.438 price mark underwent a role reversal following this break, converting from resistance to support. This new support is the area where a BUY order should be set up. This order would have been carried by new buying interest at two other times, taking the price to just under 9.000 before buying interest waned.
This move returned 41% in a matter of hours. This means that an investment of $5000 would have returned $2000 in less than hours of trading. Such a level of investment returns is not something you get every day when trading other assets.
To summarize, find the next big coin by following these steps:


