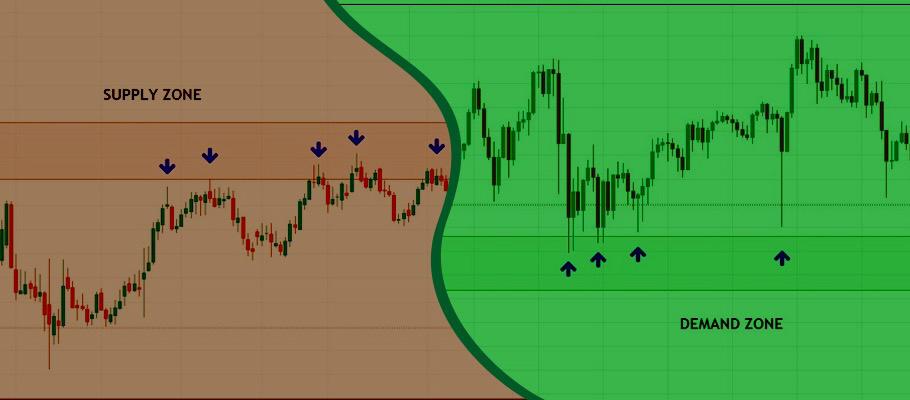
This article provides a tutorial on identifying and trading supply and demand zones in the financial markets. But first of all, what are the demand and supply zones in trading?
First, understand that supply and demand is not just a trading phenomenon. It is a principle of economics and business, and we can extrapolate the same principle to the financial markets. If supply is more than demand, the asset's price will drop. Also, the price will rise if the demand for the product or asset is higher than the supply. So supply and demand zones are areas with a high probability of prices falling (supply zone) or rising (demand zone).
There are also times when there is price equilibrium, with neither demand nor supply surpassing the order. In the financial markets, this produces an area of consolidation where price action remains range-bound. This area of consolidation is where the demand and supply zones are traced.
Demand and supply zones in forex trading or any trading are driven by institutional traders and not by retail traders. This is because the institutions have the financial muscle and buying power to force price movements. You must identify these zones and follow the institutional traders.
Supply and demand zones exist primarily due to the trading psychology of the market participants. Please notice that we speak of zones. No single price level can be identified as a supply level or a demand level. This is because institutional traders have to implement their orders in batches and not at once. That is why we speak of zones. In other words, the institutional traders are ok with placing orders with slight price changes, all within a price range. If they were to implement their large orders at once, this would cause severe price distortions, leading to flash spikes or crashes. It would also produce massive slippage, costing the institutions more money because the sudden price changes will also affect them (there are many institutional traders).
So institutional traders must fragment their positions to get the best fills without altering the asset price radically. If you read the article on this site about how institutions trade forex and other financial assets, this point was explained there.
There are specific rules that retail traders must follow to spot supply and demand zones.
Rule 1: Any moves from supply or demand zones must break the market structure. This means the move must create a higher high (upward motion from demand zone) or lower low (downward move from supply zone).
Rule 2: There must be a big sell move before a buying opportunity and a huge buy before a sell move. This is how institutional traders produce the stop hunting that takes out retail orders before moving in the opposite direction. This stop-hunting practice sucks the retail traders into the market, takes out their stops and produces new entry points that end up being cheaper than the original entry.
Rule 3: The eventual move that follows the stop hunt is fast.
Rule 4: For day traders, you must use the 1-hour time frame to detect the zones, then use the 5-minute and 1-minute chart for your trade entries. Examples to be shown later.
Rule 5: Aim to identify fresh supply and demand zones. If a zone has already produced a move once or twice, the likelihood of this supply/demand zone becomes slimmer. There are always opportunities to identify new zones, so be patient if you miss out on the big move from one area.
There are two popular methods to draw supply and demand zones.
This is the price chart (1-hour time frame) of the Nasdaq 100 index asset:
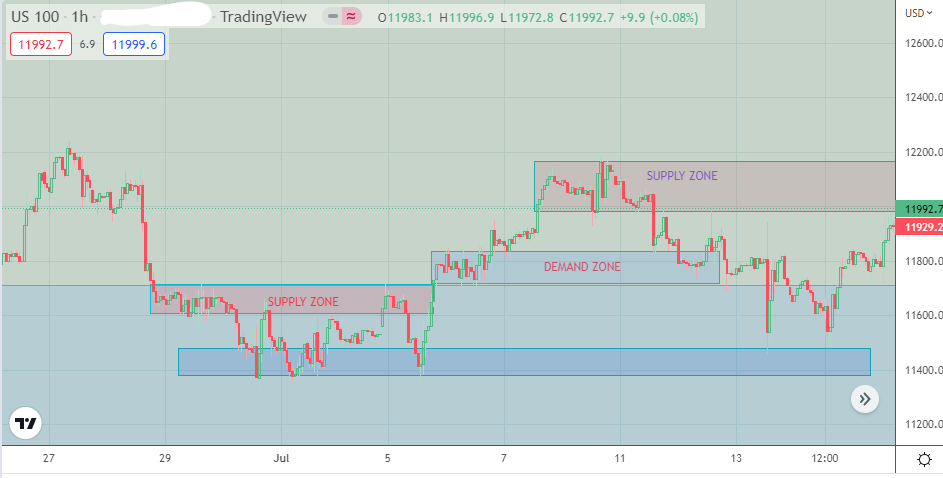
Nasdaq 100 1-hour Chart Showing Demand and Supply Zones
Here, we have drawn two supply-demand zones using the box method to capture the areas of consolidation to the upside (supply zone) and the downside (demand zone). You will notice that when a supply zone is breached by price action, it forms a new demand zone. The reverse is also the case: a broken demand zone becomes a new supply area.
Once you have drawn the consolidation zones and identified the areas of demand and supply, the next step is to buy when the asset is in the demand zone and sell when the asset is in the supply zone.
Buying and selling is not something you do whenever price action has entered the zones. It would help if you used valid entry signals:
Ultimately, you are seeking a break from the market structure. So if you are using a bullish engulfing candlestick pattern in a demand zone, the day 2 candle in that pattern closes with a higher high that breaks the previous high of the price action entering the demand zone. If you are trading a chart pattern that shows a price reversal within the supply zone, you would be looking to enter when a candle has breached the pattern's lower border to break that structure.
Place your stop loss below the demand zone's floor or above the supply zone's ceiling. Place the profit target of a SELL order in the demand zone and that of the BUY order inside the demand zone. Use a prior support or resistance level to determine that price level would serve best as the exit price.
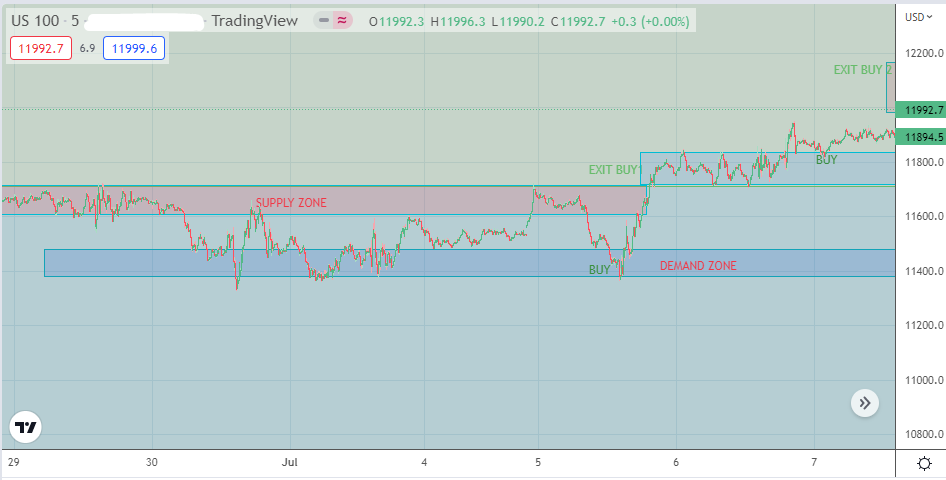
Buy Entry Example
Having identified the demand zone, the next dip into this zone produced a BUY signal which ended up breaching the ceiling of the demand zone before consolidating.
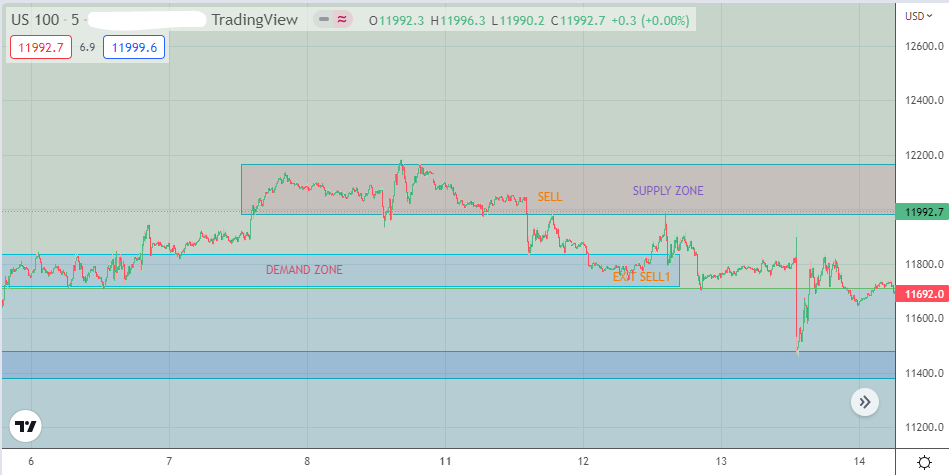
Sell Entry Example
The Sell entry example shows the price action coming off the floor of the supply zone. A closer look at the price behaviour shows the evening star pattern as the technical trigger for the selling move.
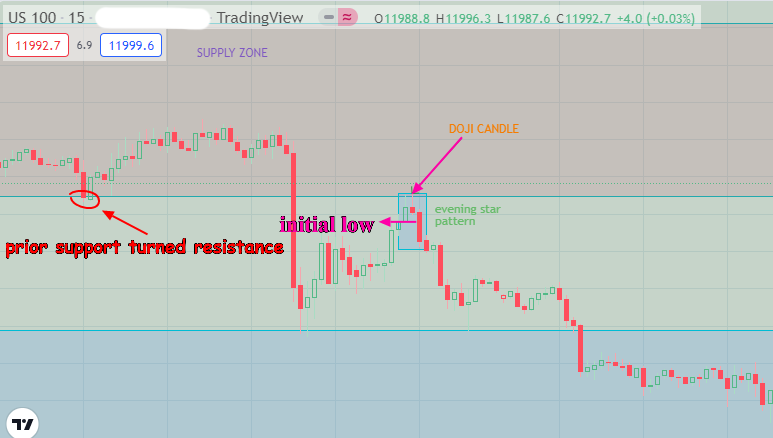
An aggressive entry would be to trade as soon as the doji candle formed, following the previous rejection of the bullish candle at the 11977.9 resistance mark. A conservative entry would wait for the third candle to create a low below the 1st bullish candle and the doji candle before pulling the trigger.


