
Institutional traders make up the other side of the forex trading divide. Institutional traders are mostly made up of banks and hedge funds. For the purpose of this discussion, emphasis will be placed on the banks, as they are the source of liquidity in the forex market.
Within the banks, there are divisions that trade the markets on a daily basis. These divisions are:
The investment bankers do not actually trade in the conventional sense of the word. What they do is basically provide liquidity to wholesale participants in the forex market. They assume the sell-side of the market, ensuring that their clients’ orders are filled at a price that is favourable to the clients. These prices are typically higher than what obtains on the exchanges on the buy side, and typically lower than the exchange’s best prices when operating on the short side of the market.
In essence, the role of the investment banks in the forex market is basically that of providing liquidity for customers who are able to take on very large orders (such as hedge funds, prime brokers and retail forex brokers). Investment banks do not deal with retail forex traders as the volumes that are traded at that level are usually out of the retail traders reach.
Picture the supply chain in any manufacturing process. There are producers, wholesalers, retailers and consumers. You may call the investment bankers the Producers along this chain, with hedge funds and prime brokers acting as wholesalers. The retail forex brokers are the retailers within this chain, while the individual forex traders are the consumers.
To be able to fulfil their banking roles in the forex market, investment banks are specialized platforms which are nothing like the retail trading platforms that retail traders are used to. These bank trading platforms are proprietary and are of two types.
The first type is the investment banking platform. This is more or less a dealing platform. The investment banker’s platform will typically have a communication section where messages can be sent to their clients on what assets are available to buy or sell. This is where clients can also communicate with the bank asking for pricing on assets and where trades are agreed on and harmonized. Therefore, this is a two-way communication channel where the client can request to either buy or sell a currency pair or a commodity or any other asset of interest. The client will inform the investment banker on the asset they want to trade, request for one-way or two-way price quotes, state the trade volume, etc. The investment banker would then be able to scan the exchanges to know the prevailing prices, and also know what volumes can be traded off on an exchange in a manner that would not skew prices. Once the investment bank has arrived at a pricing that is better than that of an exchange, but which would also provide them with a profit on the client’s position, the IB would set up the trade and feed the client with the trade information on a different section of the platform. Apart from the message board with which the bank communicates with clients, there are also charts and exchange base price feeds which the bank trader can use as a benchmark to be able to set beneficial prices for the clients. For instance, if the client wants to buy 1000 units of the crude oil asset, and the exchange price is set at 50.55/51.55, the investment banker would aim to offer the client a price that is slightly less than the exchange price. This is done to incentivize the clients to purchase from the bank rather than heading to an exchange. In this role, the Investment banker is actually assuming risk by fulfilling the client’s order. Therefore, the investment banker's job is to put out the fires. The risk assumed by fulfilling the client’s order must be quickly offloaded onto the exchanges, or onto other bigger clients who can absorb such positions at a profit. This is the secondary source of income for the bank through the investment banking model.
The second platform type is built for portfolio management. Under this model, the bank trader is trying to profit from core trading activity, where the news, market sentiment and technical analysis are all combined to trade various markets at the same time. A typical portfolio management platform would be allocated a huge sum to trade various assets or different markets. Therefore, it is a mix of not just knowing where to allocate the capital, but also how to execute entries in such a way that the prices are not skewed against the position. All trades placed by the asset manager incur commissions, unlike the investment banking model where commissions are earned.
The investment bank makes money in two ways:
Offloading large positions is not a simple process. If the orders are pushed wholesale to the exchange, it will affect pricing and the shift could make it impossible to offload the prices at a profit.
The Investment Bank will typically look at the price offered at the exchanges for the full volume. This will typically have very large spreads that the hedge fund or high-volume client does not want to pay. The investment banker will then enter smaller blocks of the trade volume, which typically brings narrower spreads. The price thus obtained is then sent to the client for execution. Typically, the investment banker will also set a time limit for the trade to be executed by the client, as prices tend to move around a lot.
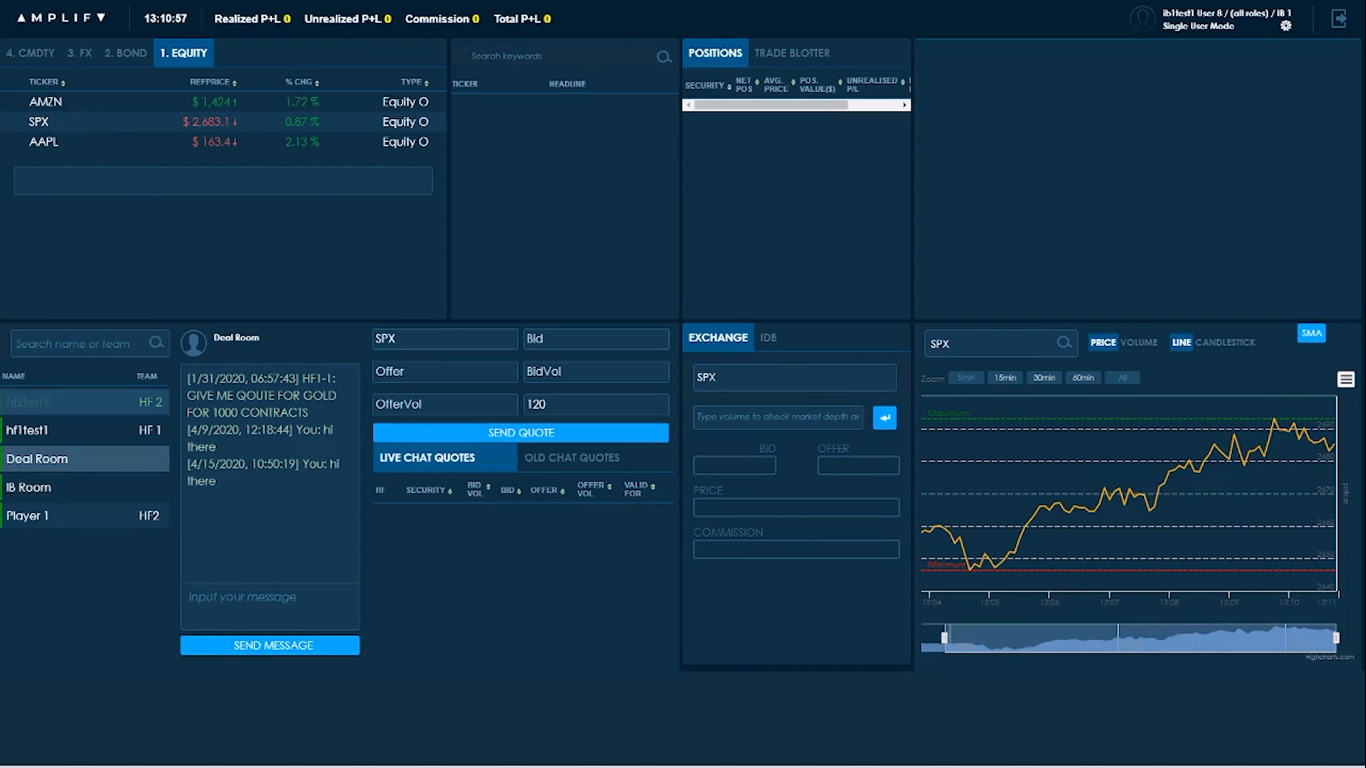
Prototype Investment Banking Platform: Source – Amplify Trading
Typically, the client may ask for a buy price (ASK), a sell price (BID) or a two-way price (buy and sell) for an asset, along with a particular volume (say, 1000 lots of the EUR/USD). If the client ends up buying 1000 lots of the EUR/USD at 1.2350 (which is a transaction size of $123.5 million), the bank would end up with a short position to the tune of this amount but would have made a commission of 5 basis points (0.05%) on the trade. This would amount to a commission of $61,750 on that trade. In this transaction, the bank is going short on the EUR/USD, since the client is buying.
However, that would still leave the bank in a negative position, because the original trade put the bank back by $123.5 million. The net negative position is now -$123438250. To clear off this negative short position, the bank would need to buy back 1000 lots of the EUR/USD from the market, and at a price that is far less than they sold it to the first client. This is the only way to clear off this negative position at a profit. The investment banker would then scan the exchanges to see where the prices are, and systematically buy back the position in smaller chunks so as not to affect the price of the currency pair radically. Assuming the bank sold the 1000 lots of the EUR/USD at a price of 1.2350, a good trade to offset the negative would need to buy back this position at a price that is less than 1.2345. The lower the buyback price, the more profitable the trade. Assuming the bank is able to offload all 1000 lots of the EUR/USD at an average price of 1.2300, this would cost the bank $123,000,000.
So what would be the bank’s PnL in this trade? The bank went short to fulfill a client’s order of 1000 lots of the EUR/USD at a price of 1.2350. The bank eventually unwound this position at a price of 1.2300. The difference in prices is 1.2350 - 1.2300 = 50 pips (0.0050 points). 1,000 lots of EUR/USD is equivalent to $10,000 a pip. Recall that the calculation of the pip value of a currency is obtained by multiplying the monetary value of that trade by the number of decimals in one pip, which is 0.0001. A Standard Lot is worth $100,000 of the base currency. Therefore, 1,000 lots = $100,000,000 of currency.
The bank would have made a profit of 100,000,000 X 0.0050 = $500,000 from unwinding that trade. Add this figure to the commission earned from fulfilling the clients’ order, and the bank would have earned $500,000 + $61,750 = $561,750.
However, it must be pointed out that the investment banker conducting the transaction has to have really fast fingers and make split second decisions on the go for the bank to make money on the transactions. If errors are made, the rapidly changing prices could put the bank’s position in jeopardy, and cost the banker money in losing trades.
The second way in which the investment banks make money from forex trading is by conducting portfolio management. This is akin to the core trading functions that most retail traders are familiar with. Here, the portfolio manager is given a large stash of cash to trade several markets with. The platforms are slightly different from the ones provided by the banks for investment banking functions.
The asset management role is all about achieving return on investment, sticking to risk limits and also getting the trade executions right. Again, because of the volumes involved in trades, the asset portfolio manager has to understand how to submit orders for execution to avoid negative market impact. Trades are routed through investment banking platforms and not through exchanges.
Remember the clients referred to under the investment banking module? As an asset manager, the institutional trader will function as a client of an investment bank. Attention must be paid to the news and the market sentiment. A lot of the trading strategy will be on a buy-only basis, except where short-selling strategies are allowed.
The asset manager must know which of the various markets offer the best possible chance for profit so as to allocate the capital properly. As such, there is a greater responsibility on the trader to achieve results than there is on the retail trader’s side.
It is important to know in which direction the institutions are trading, as the order flows will ultimately pull the asset in the direction of the trades. When an investment bank is offloading positions on the exchanges, it will affect the price and direction of the asset being traded. These are large volumes and the market responds to forces of demand and supply. If an institution is buying up a currency in large volumes, the value will rise. If the institutional players are offloading certain assets in large volumes, the supply increases and price drops.
One other role of investment banks that has to be mentioned is in mergers and acquisitions, especially when these are cross-border deals that involve exchange of cash only. If a company in Europe is buying a huge stake in an American company, that company must source US Dollars from the investment bank to conclude that transaction. The order flows generated here will favour great demand for the greenback, at the expense of the Euro. You will notice over a period of a week or two, a gradual demand shift that caused the EUR/USD to fall as the investment bank fulfills the currency exchange demands for this client using the first model discussed here.
Various tools are utilized to detect the order flows. Some of the brokers listed on this site offer Level II pricing, which shows the order flows for certain assets at certain prices. That way, you know when a major player has entered the market with a huge order. Another tool that can be used is the market profile indicator, which plots price and volume in a horizontal plane, as opposed to the conventional vertical plots that show volume on the x-axis and price on the y-axis of a forex chart.
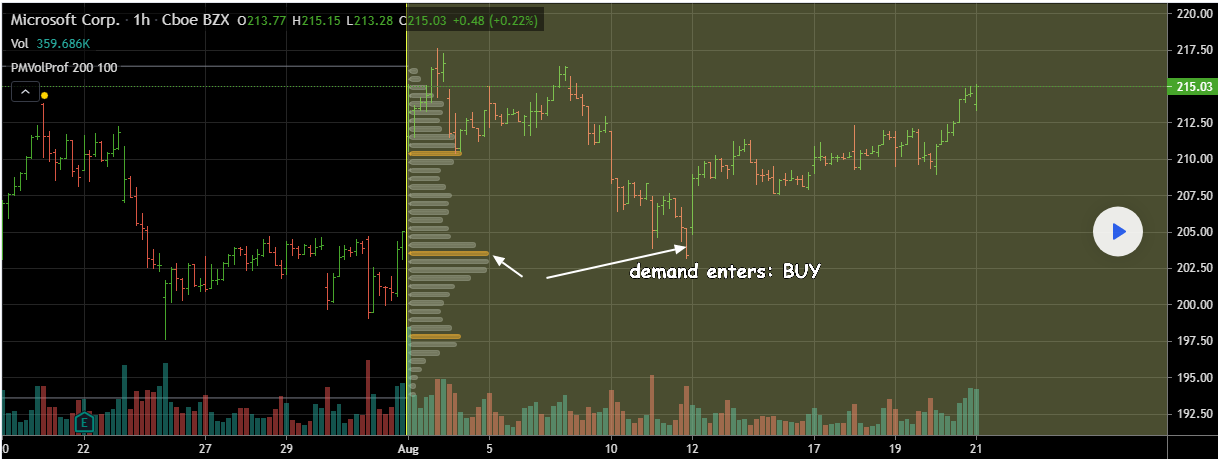
Market Profile Indicator in Action
The snapshot above shows the market profile indicator in action. Can you tell where demand has come in?
The indicator here is the horizontal volume bars on the chart that show where the greatest demand and supply has come in. For the example we are displaying, we show an area with the long yellow bar, indicating a lot of volume has come in at the end of a selling cycle on the chart. The demand as shown by this long yellow horizontal bar, translated into sufficient buying which sent prices back up. We also see the yellow bar towards the top of the page, which shows that some selling is entering and it is time for the buy orders to close shop.
This information can be used to improve trading outcomes significantly. It is hoped that this article has shed some light on how trading works on the institutional side of things, and how you can take advantage of the price movements that arise from the order flows.


