The question of whether trading indicators work or not has long been a controversial topic among traders. Some traders will claim that they don’t work and that indicators are a complete waste of time, while other traders look at them like market oracles that can be used to consistently generate profits in the market.
The reality, however, is that both extremes in this discussion are wrong. Because trading indicators do in fact work - if you use them the right way. Let’s explore how this works.
As any professional would do, traders also use tools to help them make decisions and get their job done. And trading indicators is just another set of tools we have at our disposal as traders, with others being charts, order books, and news, to mention a few.
As you would imagine for most other jobs, one tool is not enough to get the job done. Instead, you would often use tools in combination with each other. And we all know that different tools work well under different conditions. Unsurprisingly, the same also goes for trading indicators.
While some indicators may work great in nicely trending markets with clear reversals in price every now and then, the same indicator usually yields horrible results when the market changes and becomes more “choppy.” A typical indicator here would be the moving average indicator, which is often used by trend-following traders, but is notorious for providing false signals in choppy markets.
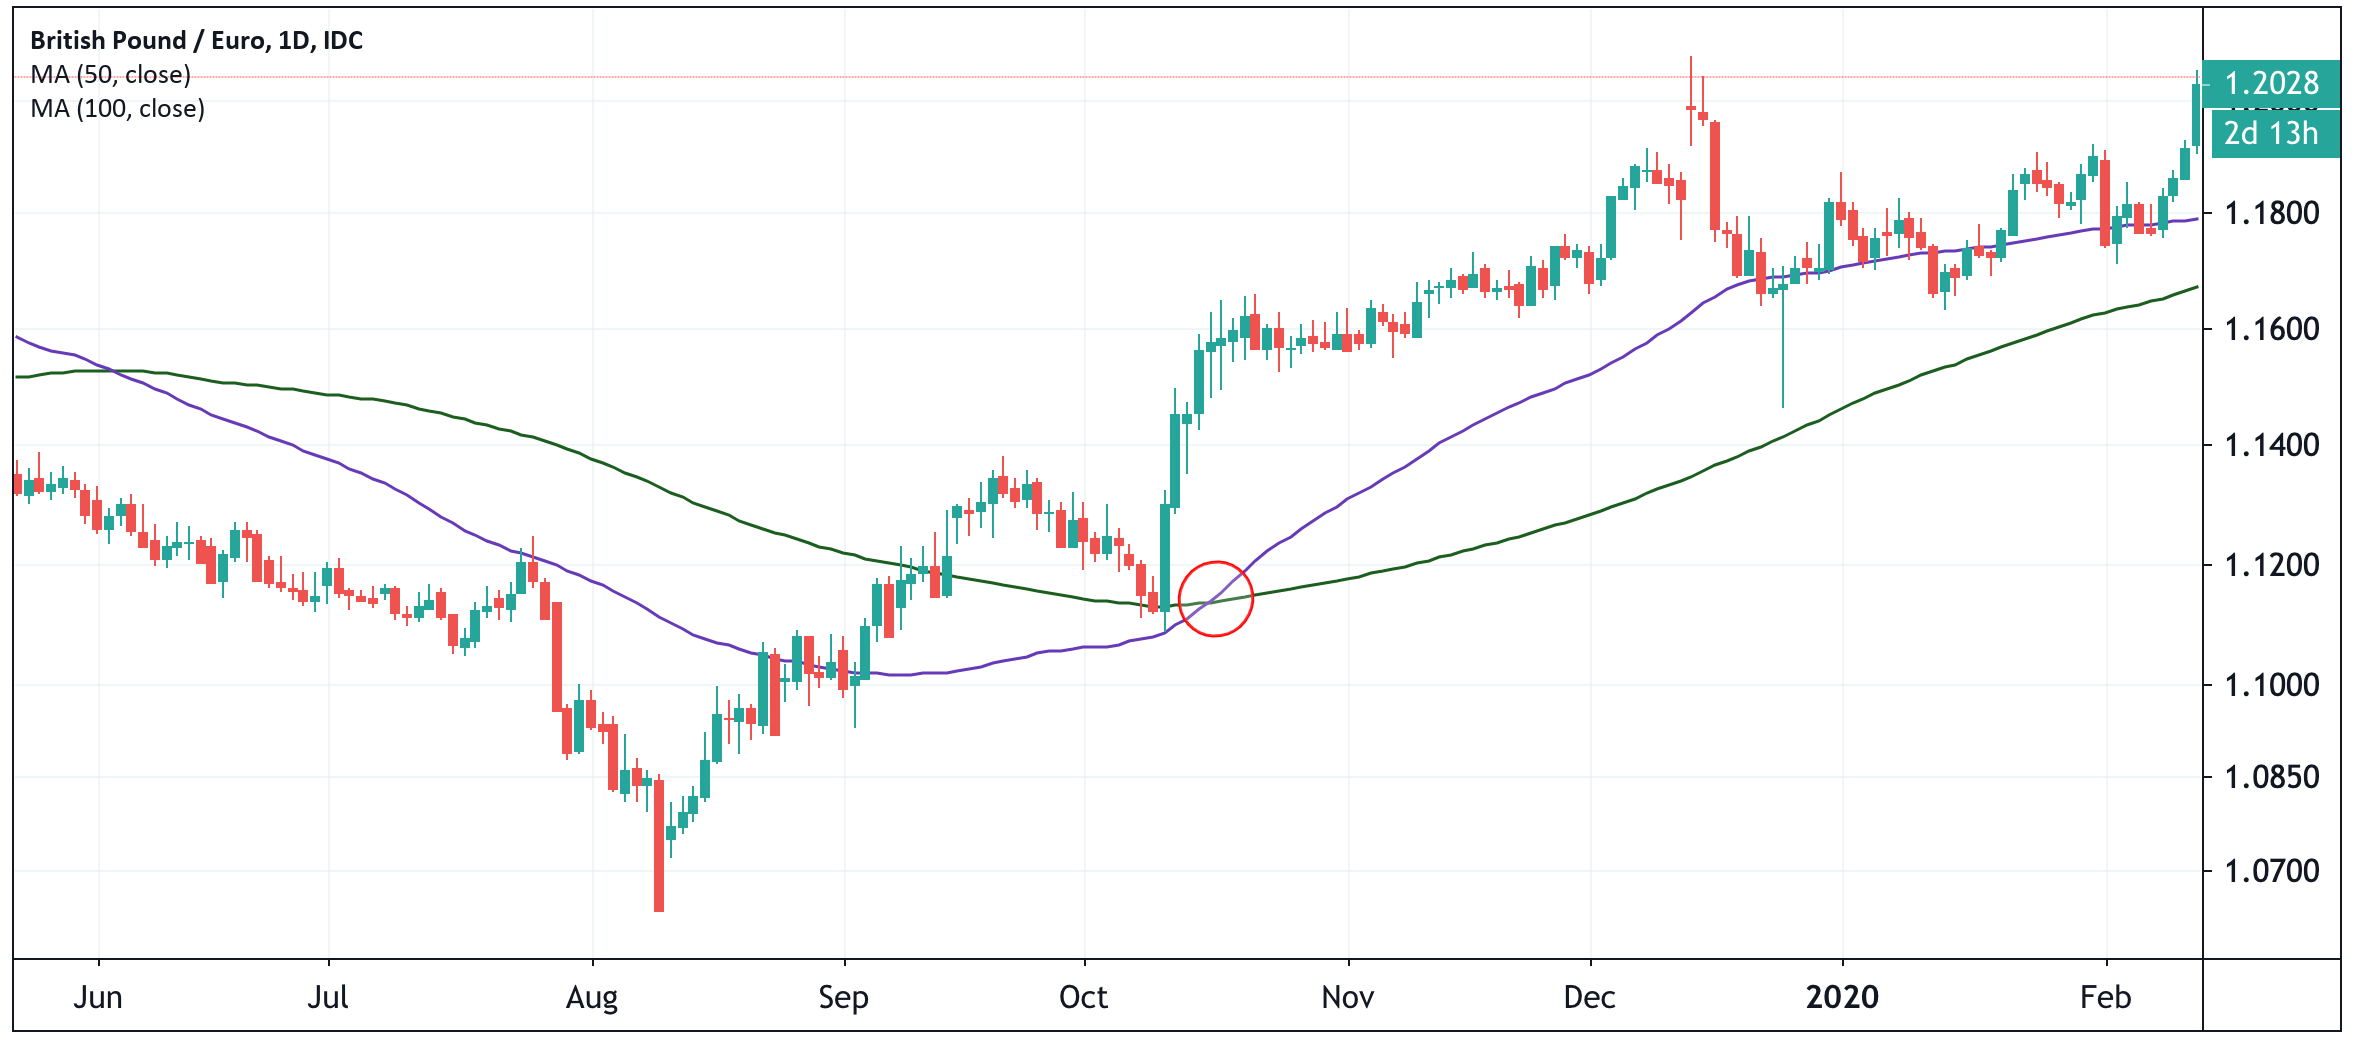
Caption: Moving Averages (MA) work well in trending markets, but are notorious for providing false signals in choppy market conditions. Moving average crossover strategies (red circle) are also popular with many trend-following traders.
Other indicators, such as the Relative Strength Index (RSI) for example, can provide clues on whether markets are overbought or oversold, and thus tend to be useful in predicting price reversals. However, it’s also true that a market can stay in overbought territory as per the RSI for a long time, especially during strong trends. As such, this is also a dangerous indicator to rely on as an oracle that can be trusted 100% of the time.
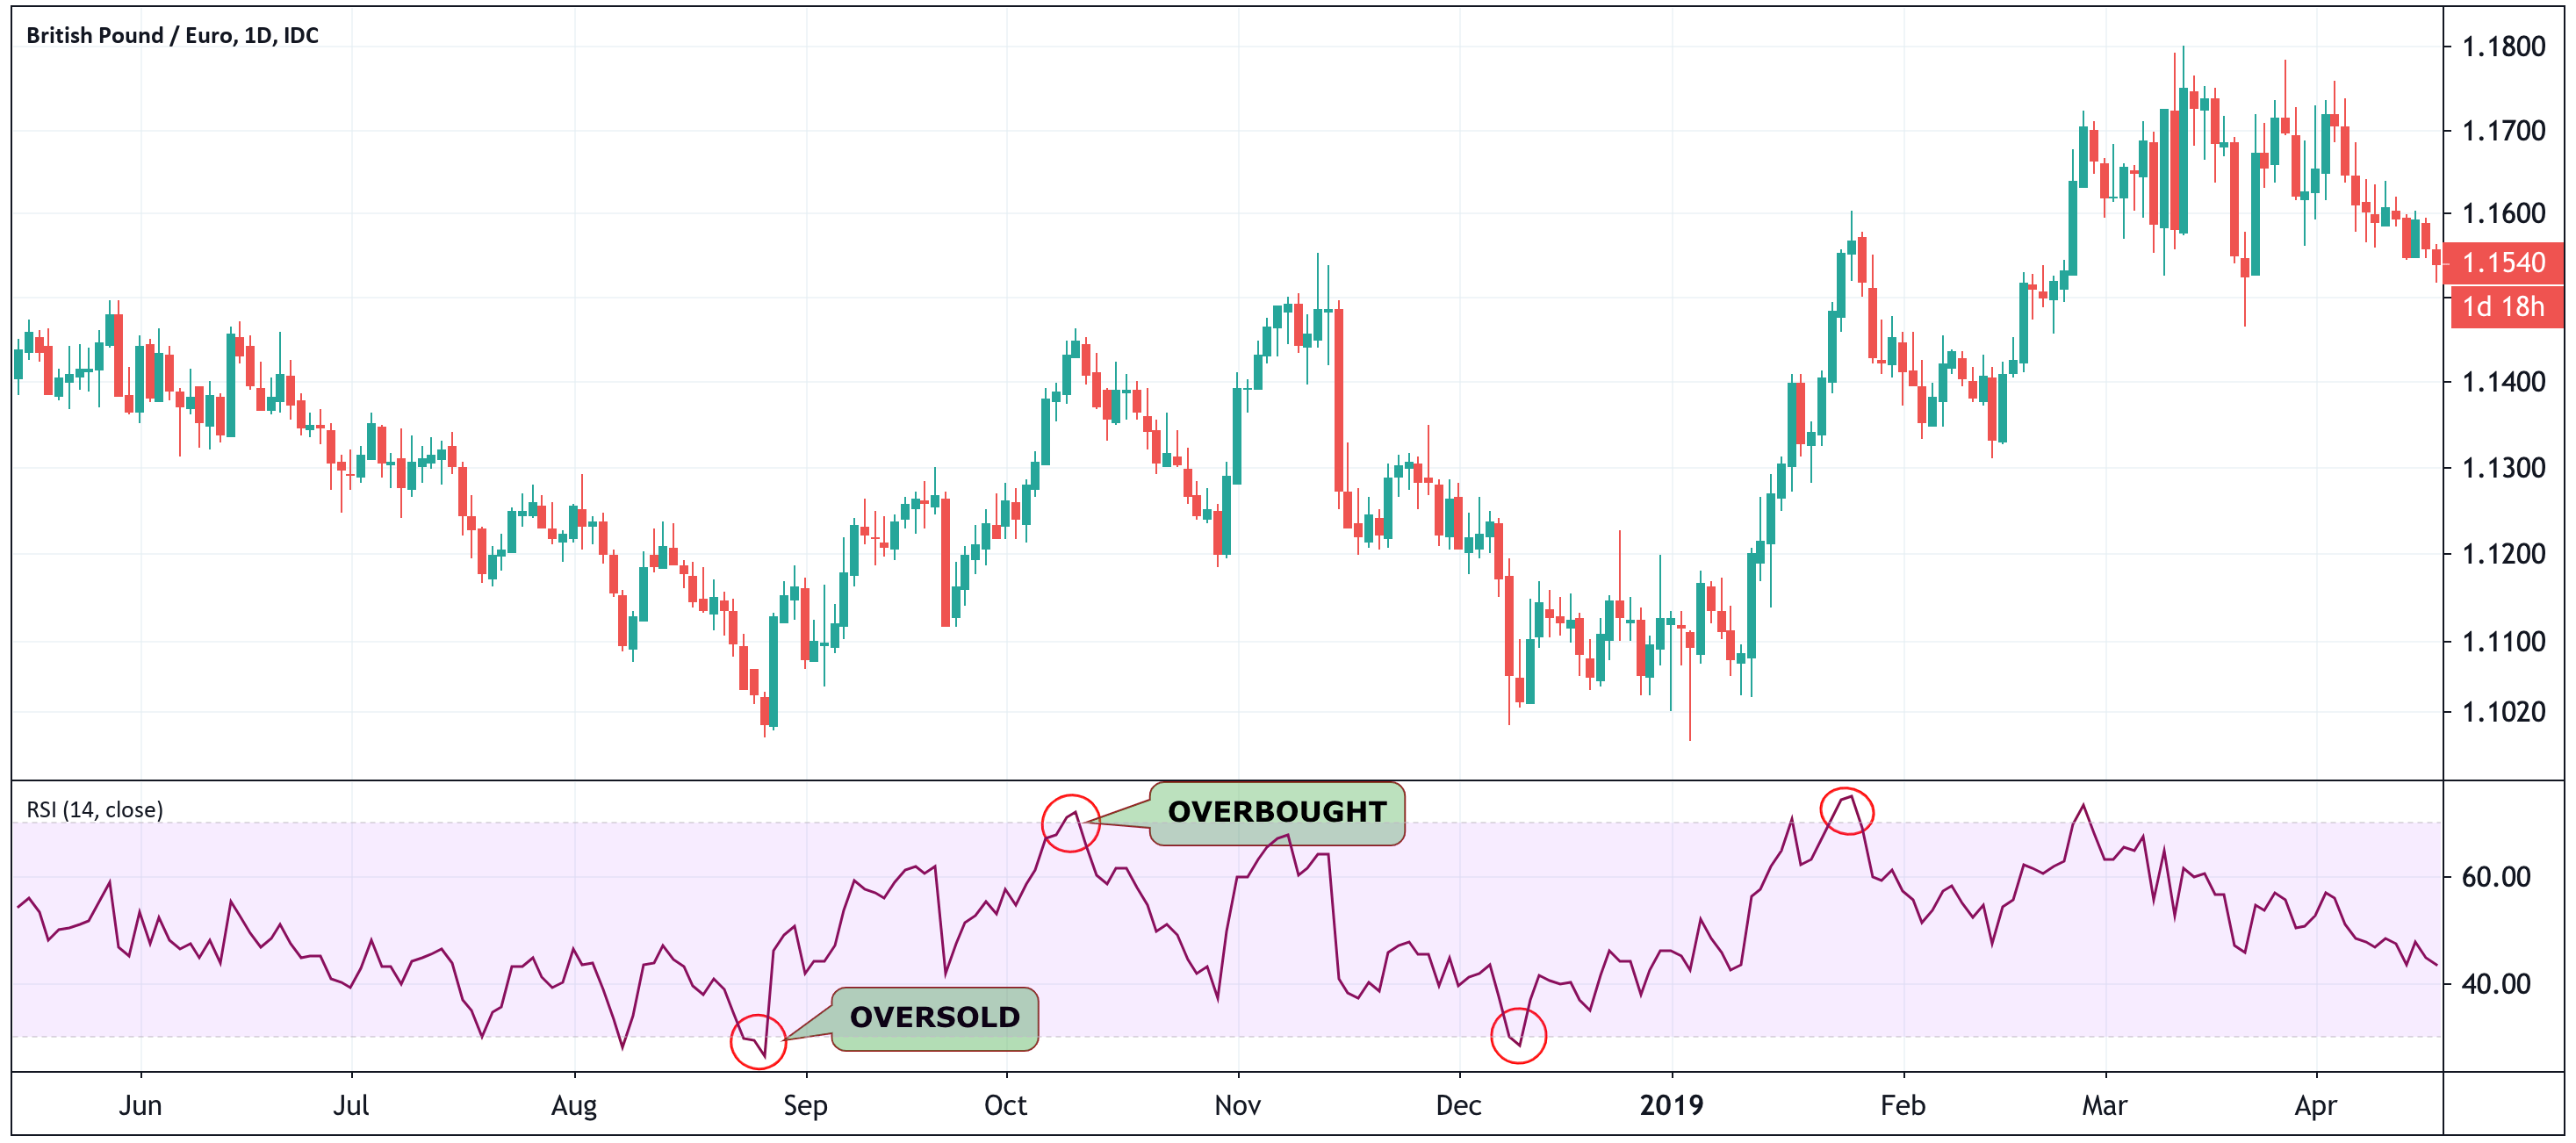
Caption: The Relative Strength Index (RSI) is commonly used to signal “overbought” or “oversold” conditions in any market. A market is usually said to be overbought with an RSI reading above 70, and oversold with a reading below 30. Keep in mind, however, that markets can remain in either overbought or oversold territory for a long time.
As you have now understood, it’s not as simple as to say that one indicator works, while another doesn’t work. In reality, all indicators work sometimes, and stop working at other times. Unfortunately, the holy grail indicator that consistently generates profits under all market conditions has yet to be discovered. And even if it existed, it would stop working the moment enough people knew about it...
Trading indicators therefore only work if you know how and when to use them. And to know that, it’s important to realize that there are some key differences between indicators. Most importantly among these differences is that some indicators are considered to be lagging behind price movements, while others are leading it.
If you think that the whole point of trading is to get in before a new trend develops, then leading indicators are for you. These are indicators that can do more than looking at past price action, which we all know is not necessarily a good predictor for future prices.
The RSI and Stochastic indicators, which are both referred to as oscillators, are generally thought of as leading indicators, along with other oscillator indicators. That’s because these indicators can signal a change in trend direction before it actually happens, by looking at whether the momentum of the current trend is weakening or strengthening.
You now probably wonder why everyone don’t just use leading indicators like these two…
The answer to that is that although leading indicators can signal a change in trend direction, it doesn’t always work. In other words, leading indicators are prone to false signals, which is why they shouldn’t be relied upon 100% of the time, and should be used with caution.
However, there are strategies that can be used to filter out many of these false signals, which brings us over to the lagging indicators.
As you may have guessed, lagging indicators are indicators that lag behind price movements in the market. These indicators are also known as trend-based indicators, given that they can tell you whether or not the market is trending in a certain direction.
Important to note, however, is that you will only get a signal from a trend indicator after the new trend has already formed, making it impossible to catch exact tops and bottoms in the market. Instead, you would be aiming for the middle chunk of the move that occurs between a bottom and a top.
One interesting way to use lagging indicators, however, is as a way to confirm signals from one of the leading indicators. For example, after one of the leading indicators provides a buy signal, you could wait for a lagging indicator to confirm that signal by showing that the trend in the market is indeed up.
This way, you can eliminate some of the many false signals given by leading indicators by waiting for secondary conformation from a lagging indicator. This way of combining different types of trading indicators has the potential for crafting some very powerful trading strategies, whether they’re intended for use in the crypto, stock, or forex market.
Among the most common lagging indicators is the Moving Average (MA) indicator that we discussed above, as well as other popular indicators such as Bollinger Bands (BB) and the MACD (Moving Average Convergence-Divergence).
In conclusion, the most important takeaway when it comes to trading indicators is that there is no single holy grail that will guarantee you profitable trading as long as you use it. Instead, there are different indicators that each have their own strengths and weaknesses. While some of them may work well at certain times, they may completely fail at other times.
The best way to use technical trading indicators is therefore to combine different types of indicators - in particular leading and lagging indicators - to build a robust trading strategy that filters out as many of the false signals as possible. By doing that, you stand the chance of giving yourself a true edge in the market, based on statistical probabilities rather than luck and gut feeling.


