Charts are the means by which price action by market participants is represented. Picture charts as a form of a graph with a y-axis and an x-axis, where price is plotted on the y-axis and time is plotted on the x-axis. This is what forex charts are all about.
There are several types of forex charts, but three types are more commonly used among all others. These are as follows:
The line chart is a forex chart in which price activity is represented by a single line, which is formed by joining the closing prices of each time period together. The time period could be as little as 1 minute, or it could be over 5 minutes, 15 minutes, 1 hour, 4 hours, 1 day or 1 week.
Here is what a line chart looks like:
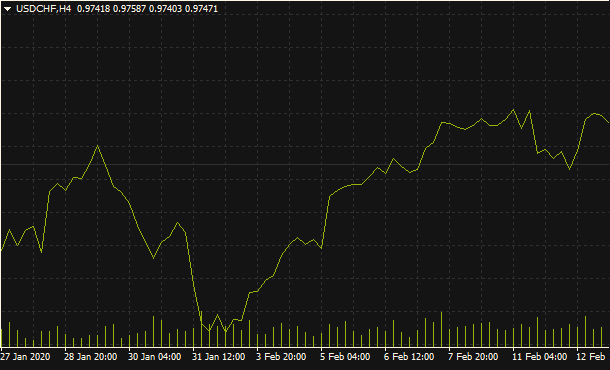
Line chart
The line chart is the simplest type of chart and presents price action in a clean format, without all the market noise and also without all the complicated indicators that tend to confuse retail traders. It is important to note that Charles Dow, the man behind the Dow Theory and after whom the Dow Jones Industrial Average (New York Stock Exchange) is named, only used closing prices in his postulations. Therefore, the line chart is great for traders who simply want to trade with price action. This is especially true for support and resistance setups where it is important to know where price for a time period ended relative to the key price levels.
The advantage of the line chart is that it removes some of the subjective bias that can come into a trader’s mind when other forms of charts are used. The disadvantage is that a line chart is basically useless for in-depth analysis of a forex pair. Having defined this basic chart type, we can now discuss the other two.
The bar chart or the Western chart is a chart type which depicts price activity for a time period using a single vertical bar to indicate the high and low prices, as well as a short horizontal bar to the left for the opening price and another short bar to the right of the vertical bar to depict the closing price. Each bar represents a time period, according to the time frame selected on the chart.
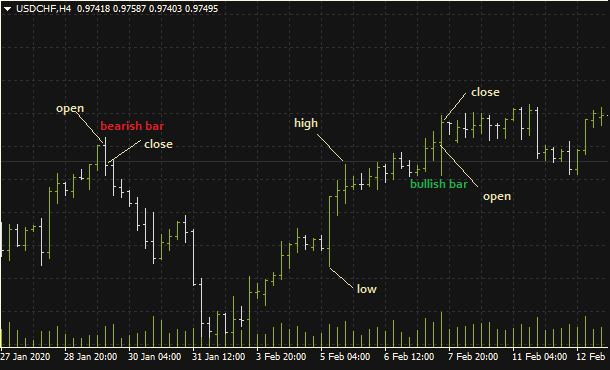
Bar chart showing bullish and bearish bars
You will notice that the position of the short horizontal bars is different for the bullish and bearish bars. In a bullish bar, the open price is lower than the closing price, so the branch on the left will be lower than the branch on the right. Conversely, the branch on the left will be higher than the branch on the right if the bar is a bearish one.
The bar chart has its origins in the Western world, and was the method of price representation adopted in Western markets. It is still popularly used by Western chartists today. It has an advantage in the sense that it can be used by analysts who are experienced in their use. The disadvantage is that it is difficult to read the behavior of buyers and sellers on each individual bar.
The candlestick chart is named that way because the method of representation of price activity for each time period resembles the shape of a candle, with a body and a wick (which could be on top, at the bottom or both). The candlestick chart was used in trading rice contracts in Japanese exchanges in the 1700s, and therefore are of Eastern origin. It was only introduced into Western markets and became popular after the American chartist Steve Nison started to use it.
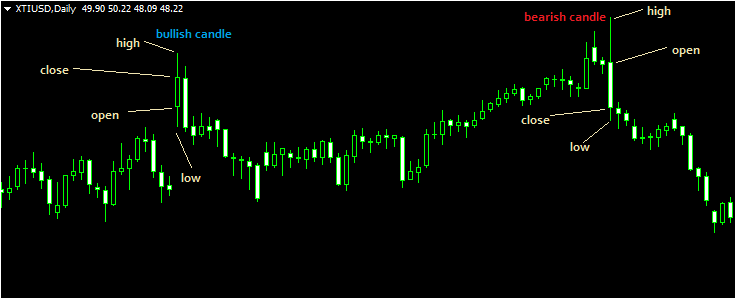
Candlestick chart showing bullish and bearish candlesticks
Each candlestick has a body (which shows the open and closing prices) and a wick (called the shadow). Some candles have one shadow, others may have two and some may have none at all.
The chart shown above shows various candlesticks. Some are bullish (transparent) while others are bearish (opaque). Sometimes the chart represent bullish candles with green colour (or white) and bearish candles with a red colour (or black).
Every candlestick shape tells a story. The shape, length of the body/shadow as well as presence/absence of one or both shadows, all paint a picture of what is happening in the market. Even a candlestick which has no body tells a story.
The ability to paint a picture of what buyers and sellers are doing in the market is a key advantage of the candlestick chart. They can be used to form patterns which provide trading signals as to what will happen next. Perhaps the only disadvantage is that a wide range of candlestick patterns exist and traders need to devote time to study them to be able to understand and use them efficiently.
The three chart types all have the following characteristics:
One of the time-tested methods of trading is using support and resistance areas to trade. The dilemma that candlesticks present is whether to use the high/close (downtrend) or low/close (uptrend). With a line chart, this problem is solved as only the closing prices are used. These tend to be more accurate.
So do not discard your line charts and consign them to irrelevance. Use each type of chart in the appropriate situations to better your chances of success in the market.


