When we talk of oscillators, we talk of the category of market indicators that are categorized as the momentum indicators. If you open an instance of the MT4 or MT5 client terminal, you will see this category of indicators listed on the trading platform. Examples of oscillators are:
Oscillators are generally made up of a signal line, as well as an indicator window that has a vertical range which can be divided into two equal halves by a midline. Some oscillators such as the MACD may have extra components such as histogram bars or moving average lines. However, these oscillators still retain the core components of an oscillator.
Forex traders will easily tell you that one of the pitfalls they try to avoid is entering late into a trade. This is usually the problem with lagging indicators such as moving averages. However, oscillators change the game completely in this regard. They are leading indicators and therefore they present signals of where a trade could potentially go before the price action actually moves in that direction.
However, this presents another problem: that of presenting signals that may end up being false positives. However, there are ways to mitigate this risk, and these are what will be discussed below in presenting two simple ways to use oscillators in trading forex.
The two methods described below can be used in trending as well as consolidating markets. These are the divergence trades, as well as the midline crossover.
The divergence relies on the two qualities that most oscillators have: the presence of a signal line which mimics the movement of the price, as well as a vertical range in the indicator window, which have price extreme areas.
The signal line of the popular oscillators is usually derived from Mathematical calculations. We will not concern ourselves with these calculations. All we need to know is that there is a signal line which mimics price behavior, except at certain times when this line deviates from the price behavior. These moments of deviation are the divergence opportunities that can be exploited for profit.
Divergence means “to be different from”, or to “deviate from the norm”. Here, the norm is the price action, and the indicator’s signal line is usually in synchrony with the movement of the price. However, there are times when the indicator goes out of sync with the price. This usually resolves with the price realigning itself with the oscillator’s movements, thus correcting the deviation. This correction is what you should catch and follow with your trades.
The best divergence signals are obtained when the signal line of the oscillator is in the price extreme areas. These price extreme areas are the extremes of the vertical range in the oscillator’s indicator window. The upper price extreme is the overbought area and the lower price extreme is the oversold area. Please note: the presence of the oscillator’s signal line in the overbought or oversold areas is not an automatic invitation to buy or sell the currency pair. This common mistake made by many traders is what the divergence trade seeks to eliminate.
The vertical range calibration differs from one indicator to another, and therefore the numerical values that correspond to the price extreme areas will also differ. You can look up the price extreme levels for the various oscillators on your MT4 platform.
The divergence produces two setups: one each for long and short trades.
The reference points for the oscillator and the price are two successive peaks and troughs (i.e. two highs and lows). For a long trade, the oscillator’s signal lines should show progressively higher lows on two successive troughs, when the price shows two successively lower lows at the same points. This indicates to the trader that the oscillator is leading the way to the upside, and price will follow suit. So the long trade is setup to capture this correction.
This brings us to the next question: how is this price correction captured with a timely entry? This is where a sound knowledge of candlestick patterns as well as support trading comes to the rescue. Use a bullish reversal candlestick pattern to determine the entry. If this area lies at a price level where there has been a previous support, it enhances the accuracy of the setup. This is illustrated in the snapshot below.
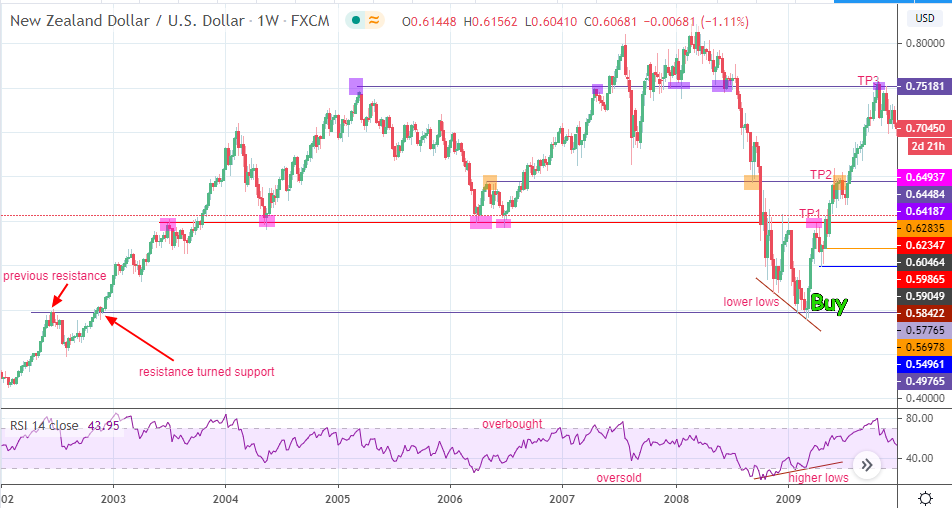
Divergence Setup for Long Trade
The divergence correction shown above displays the following points of note:
The entry area where price and oscillator formed the divergence signals has been enlarged to display the candlestick pattern that formed the basis for the long entry.
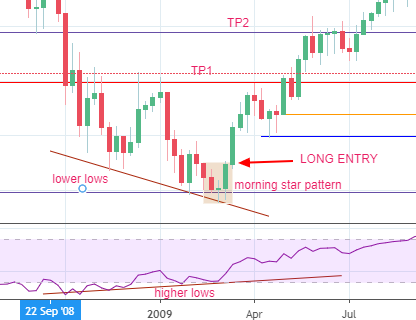
Candlestick Basis for Long Entry
This pattern is the morning star pattern, which is formed by a bearish candle as the 1st candle (the initial trend), a doji candle (indecision) and then a bullish candle whose closing price is higher than the highest price on the bearish candle (indicating a change of trend). The entry is placed at the open of the candle that follows the candlestick pattern.
For a short trade, we seek two successively lower highs on the oscillator’s signal lines when the price shows two successively higher highs at the same points. This indicates to the trader that the oscillator is leading the way to the south, and price will follow. The same principles for trade entry and exit apply, and these are illustrated in the snapshot below.
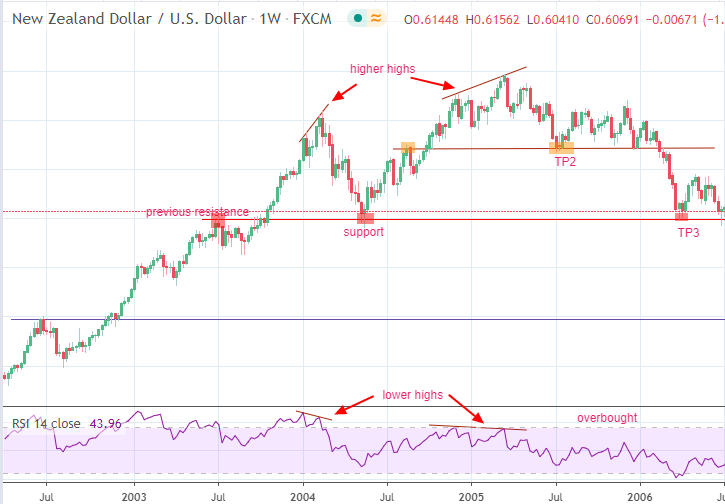
Divergence Setup for Short Trade
The divergence correction shown here displays the following points of note:
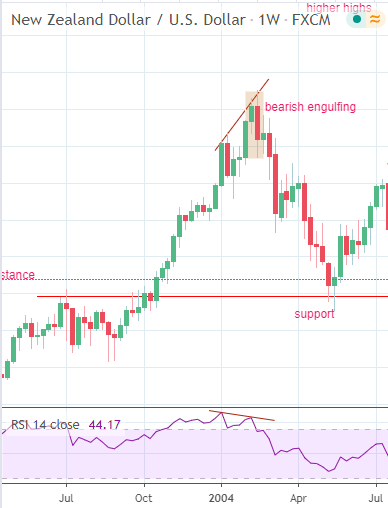
Bearish engulfing pattern shows the way to a short entry
The divergence area for the first setup shows a bearish engulfing candlestick pattern. The entry is made at the open of the candle that follows the candlestick pattern.
The divergence setup has a high degree of accuracy when the trader is able to spot the divergence and make the entry as directed on the chart.
The midline cross is another way to use the oscillator indicators. The signal displayed here is the signal line’s cross of the midway point in the vertical range of the oscillator. Not every oscillator is suitable for use in this manner. Only use those oscillators with vertical ranges that are constant (e.g. RSI, CCI, Williams %Range). The momentum oscillator or the Relative Vigor Index (RVI) do not work very well with this strategy in my experience because their vertical ranges are not constant.
You have to use another indicator on the price section of the chart to mimic the midline of the oscillator window. You can use the 80-period exponential moving average for this. The strategy is for the signal line of the oscillator to cross the midline a short while before the price does the same on the horizontal line or the 80-EMA. The setups for the long and short trades are shown below.
Price must be located below the 80-EMA line at the time of the midline cross. The first step is to apply the 80-EMA on the chart. The 80-EMA acts as a dynamic support/resistance line. In this instance, we are basically trading the breakout above the resistance or the 80-EMA. This has to be represented by the cross of price above the 80-EMA.
Allow the oscillator’s signal line to cross above the midline. Watch for the price to do same on the 80-EMA a short while later. Use a pullback entry or a candlestick pattern entry that supports an upward move to initiate the long trade. The profit target is set using a previous resistance that is higher than the one used for trade entry. This is illustrated below.
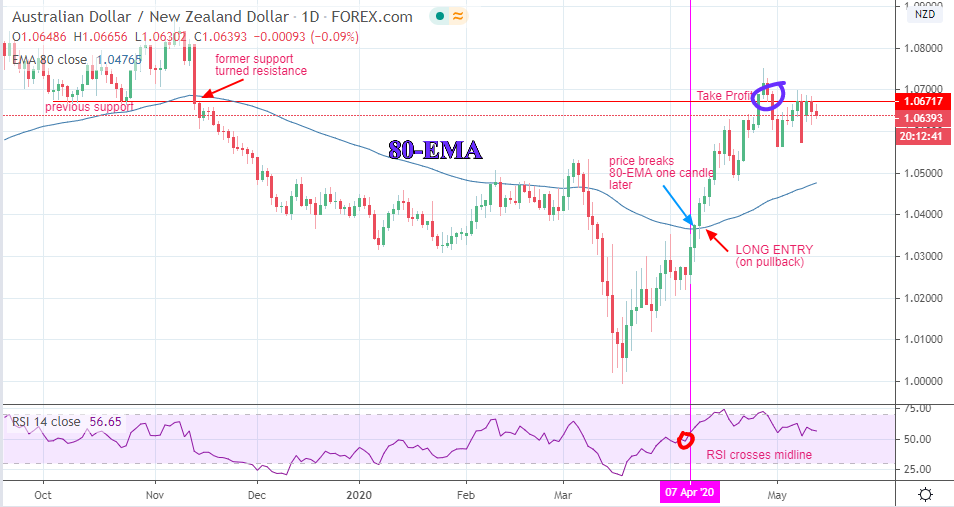
Long entry based on midline cross to the upside
The 80-EMA (blue line) is the dynamic resistance to rising prices. We can see that the red circled area in the indicator window corresponds to the 50.0 midline point (the RSI has a vertical range of 0.0 to 100.0). The purple vertical line shows that the RSI was already above 50 (value is 56.65; can be seen on the left side of the indicator window). At that time, the price was still below the 80-EMA. The cross of the price above the 80-EMA and closure of the candle above the 80-EMA only occurred two candles after the RSI had crossed. This was a daily chart for the AUDNZD; two candles are therefore the equivalent of two days of price activity on this pair. The long trade is setup to capture any pullback to the 80-EMA line.
The Take Profit is set to an area where price had previously found resistance. This must be a higher resistance than the one used for trade entry. Please ensure that the breakout candle used to judge the cross of the price above the 80-EMA obeys the 3% penetration price filter. This rule states that the distance between the key resistance (or support) and the closing price of the candle must be at least 3% of the length of the candle for the breakout to be valid.
The short entry follows the same principles in reverse. Again, price must be above the 80-EMA at the time of the midline cross by the oscillator. The trader seeks a midline cross by the oscillator, followed by the cross of the price bars or candles below the 80-EMA line.
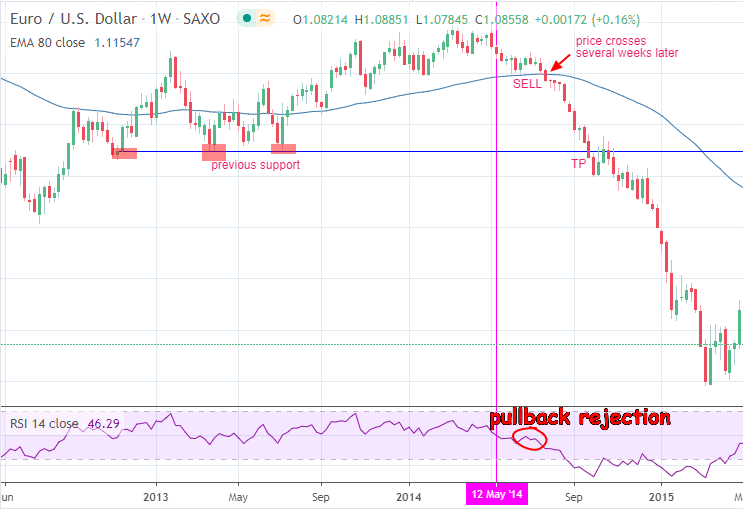
Midline cross to the downside ushers in short trade opportunity
Here, we have a unique situation. The midline cross of the oscillator happened several weeks before the price followed. At the time the price was crossing the 80-EMA to the downside, the signal line of the oscillator was rejected at the 50.0 midline point. This pullback rejection reinforced the cross of the candle below the 80-EMA. Take profits at the price which corresponds to a previous support.
These are the two ways you can use oscillators in the forex market. If you apply them, you will ditch some of the erroneous methods of trading that you may have been engaging in using these wonderful trading tools.


