
Published: November 5th, 2025
Zksync increased 15% in only one day after the upgrade was announced, culminating in a weekly surge of 65%. Its increase was sparked by a number of factors, the primary one being Vitalik Buterin's support for the Ethereum Layer-2 chain.
The co-founder of Ethereum stated on November 1 that ZKsync's efforts to the Ethereum environment are significant, despite their frequent underappreciation. The network's Atlas modifier, which promised considerable increases in throughput and finality, was the subject of his comments. The cryptocurrency saw a 70% increase after the announcement.
However, ZKsync's latest tokenomics proposal's long-term advantages will rely on how much money it can make. This covers both off-chain collaborations and network usage revenue.
Let's see the future price direction from the ZK/USDT technical analysis:

In the daily chart of ZK/USDT, the major market momentum is sideways, where multiple violations are seen in near-term highs and lows. Primarily, a volatile market structure is visible from where a valid price rejection is needed before anticipating a stable movement.
Looking at the higher timeframe, the price dipped and rebounded from the all-time low in October 2025. After having a bearish monthly close, the price shows a buying sign by moving beyond the monthly opening price level. As long as the current price hovers above the 0.0503 monthly flip point, a bullish continuation is likely.
In terms of the volume, the price is trading at the consolidation zone, where a bullish high-volume breakout is clear. Moreover, the buying pressure is supported by a strong exhaustion at the bottom, signalling sellers wiping out from the market. Primarily, we may expect further buying pressure as long as the high volume line is below the current price.
In the main price chart, a strong bullish breakout is visible from the 200-day Simple Moving Average. The 50-day EMA follows the same, with a bullish slope formation, which signals an additional bullish continuation signal.
In the secondary indicator window, the Relative Strength Index (RSI) moved higher and found a peak at the 70% level. Primarily, as long as the RSI hovers above the 50.00 line, we may expect the buying pressure to extend.
Based on the overall market momentu, ZK/USDT price is trading within a bullish trend where sufficient buying pressure is possible from the intraday range breakout. Primarily, the bullish pressure might find a barrier at the 0.0735 resistance level. A bullish break with a stable price above this line could open the room for reaching beyond the 0.1100 level.
The alternative trading approach is to find a bearish daily candle below the 0.0442 level, which might invalidate the buying pressure and take the price towards the 0.0280 support level.

In the H4 chart of ZK/USDT, the major market momentum is bullish where the current buying pressure is supported by a strong bullish breakout. Moreover, the future cloud is positive to bulls as both Snkou Span lines are aiming higher with a wider gap.
In the secondary indicator window, the MACD Histogram rebounded the position and moved to the neutral point. Moreover, the Signal line is at the upper peak area with a sideways pressure. Overall, the MACD suggests a potential bullish peak formation, suggesting a downside recovery.
Based on this structure, the major market moment is bullish higher and correction is pending. In that case any bullish opportunity near the kitchen area could be a trend continuation signal where the ultimate target would be to test the 0.0800 psychological level.
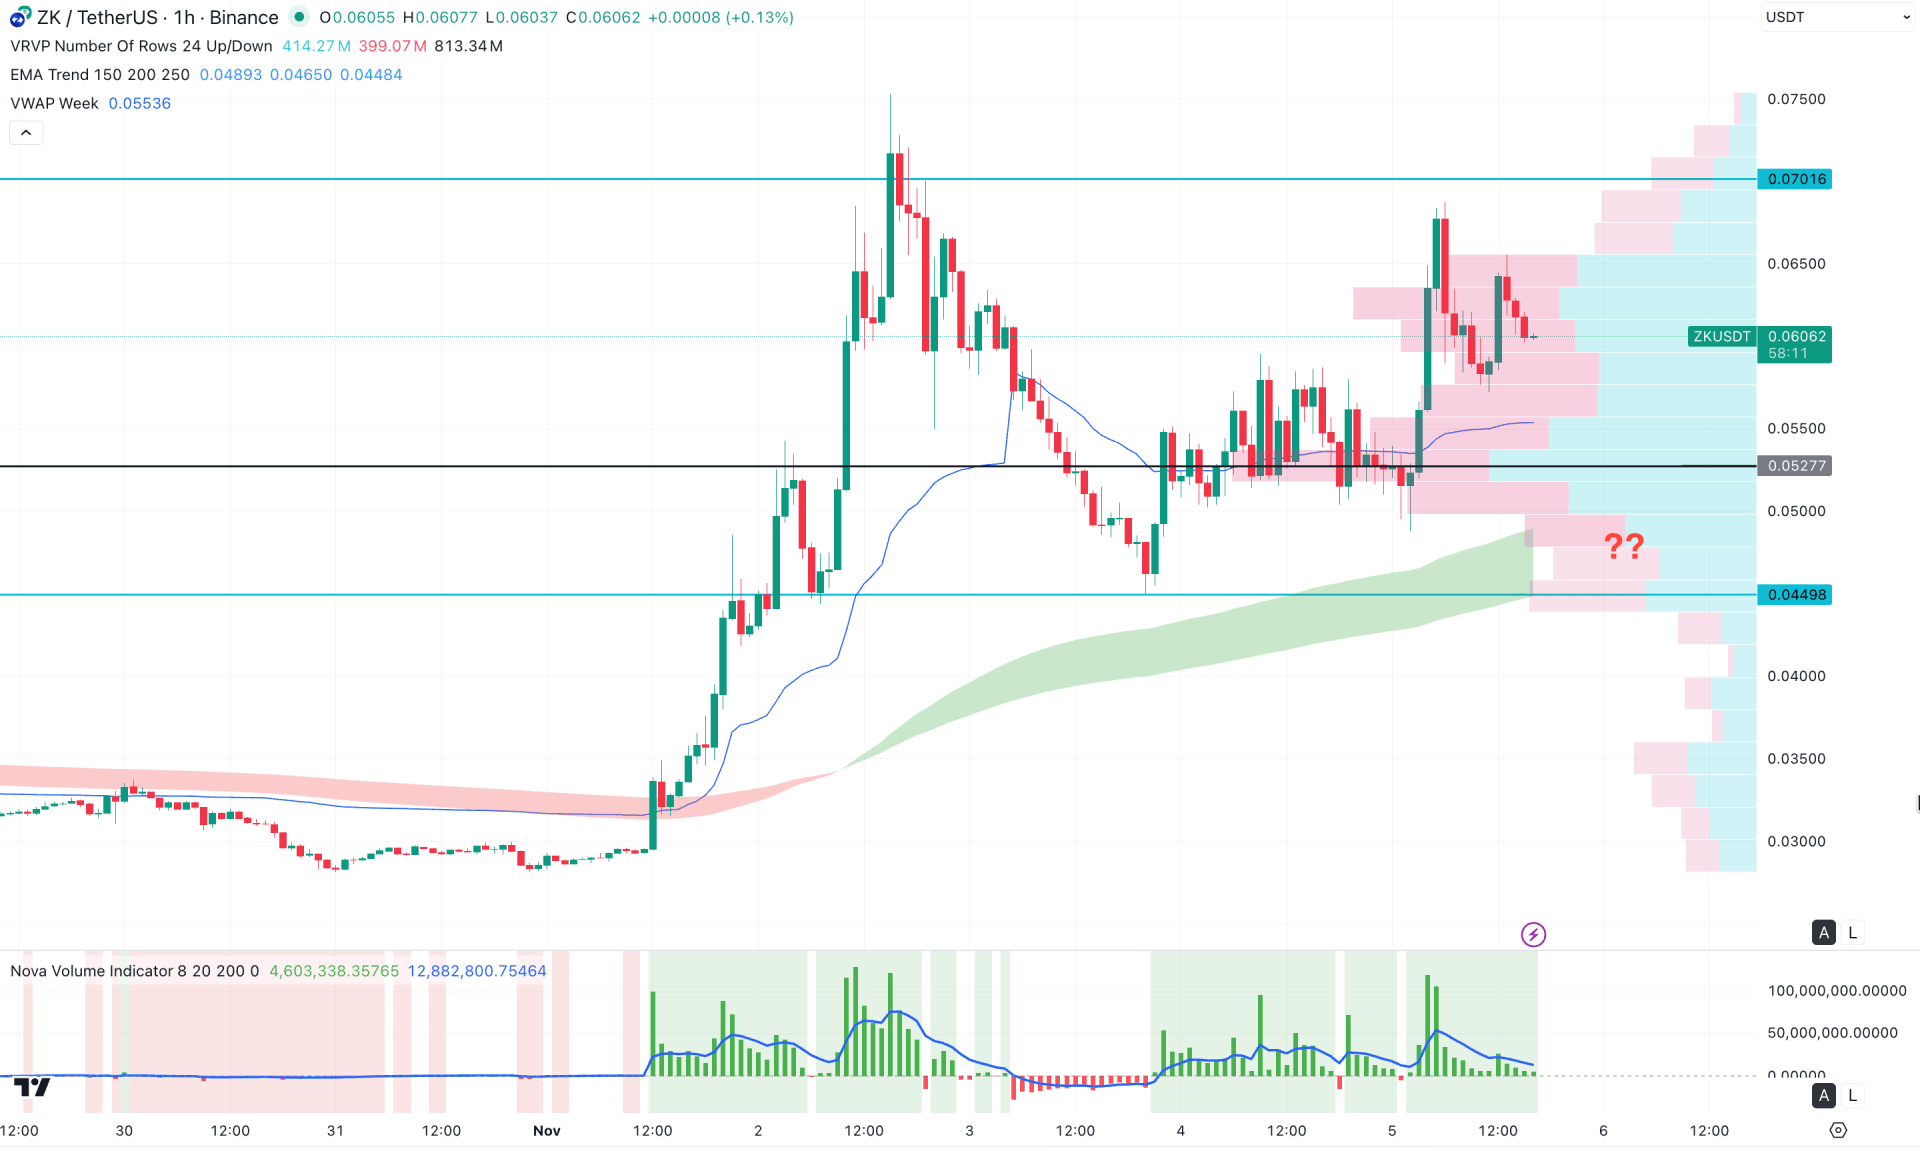
In the hourly timeframe, the current price is trading bullish within the visible range. The high line lies below the current price, supported by the rising BWP level. Additionally, the Exponential Moving Average (EMA) wave is acting as major resistance for sellers and remains below the overall structure.
In the secondary indicator window, the volume histogram suggests corrective pressure from higher levels, indicating that more confirmation is needed before anticipating a trend-trading opportunity.
Based on this structure, a minor downside correction followed by a bullish rejection from the VWAP line could present a potential long opportunity, with the primary target set around the 0.07010 level. However, failure to hold the price above the EMA wave could serve as a warning signal, as it might push the price lower toward the 0.0350 area.
Overall, ZK/USDT is trading in a stable uptrend from the recent swing low. A buy signal might appear from the intersection area, indicating that a bottom has likely been established. Investors should closely monitor price action, as a potential profit-taking phase followed by a valid bullish reversal could help resume the existing uptrend.


