
Published: March 4th, 2021
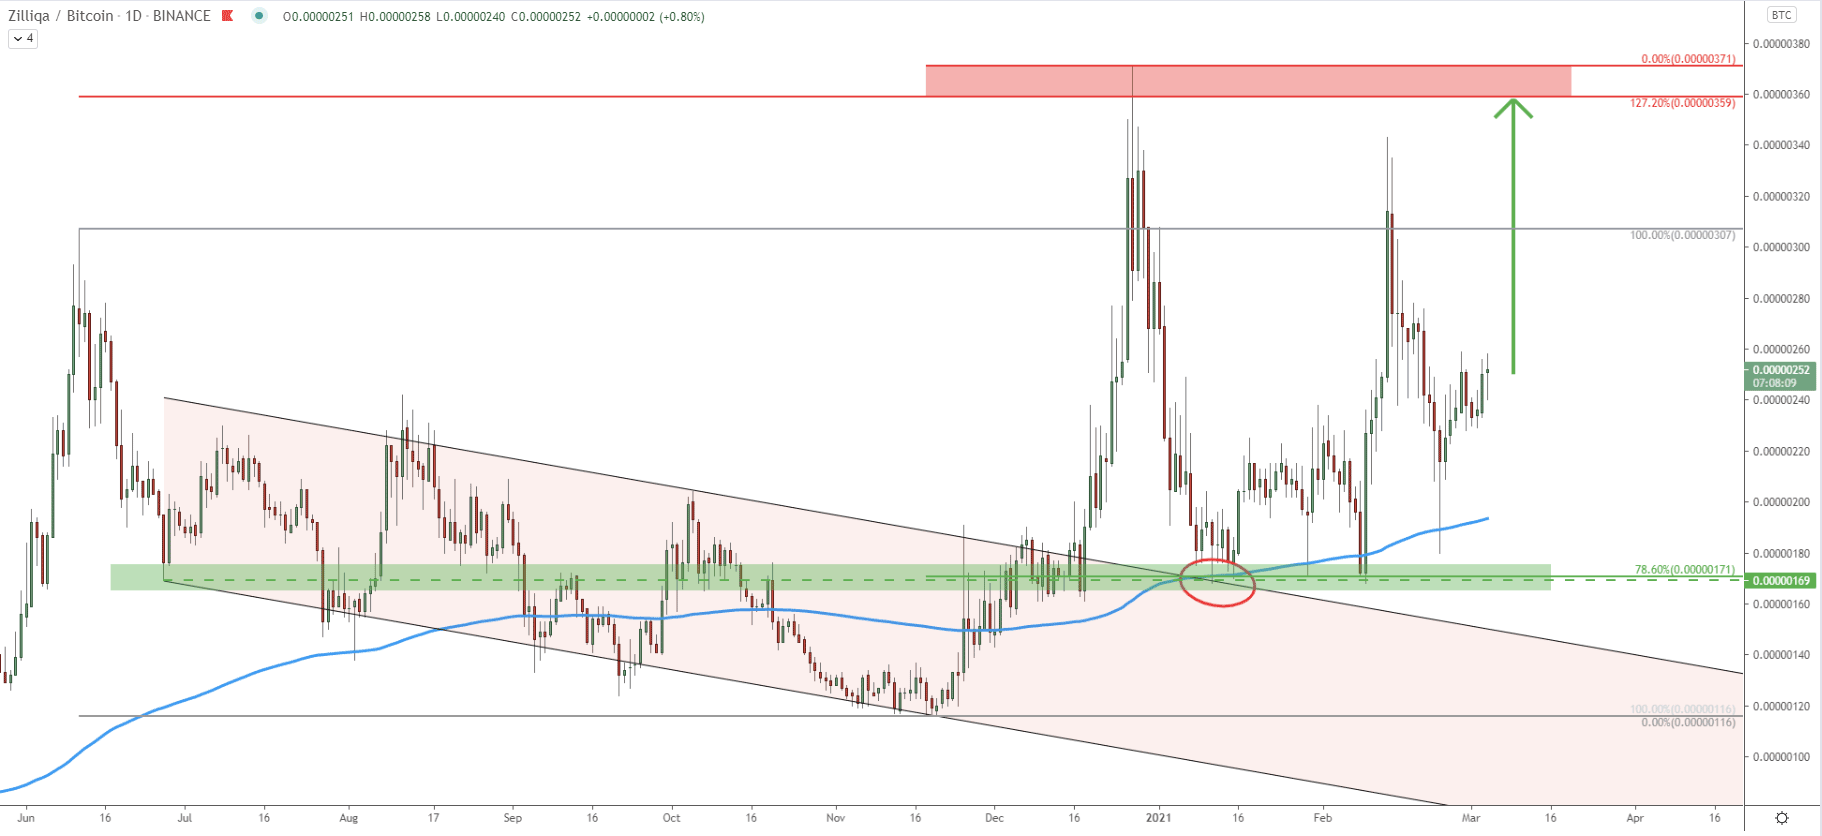
We will start by analyzing the Zilliqa coin against the Bitcoin and then will jump into an analysis of the ZIL/USDT. On the ZIL/BTC chart above it can be seen that the price has established an uptrend after it broke above the descending channel. The key support has been formed at 171 satoshis, which is a 78.6% Fibonacci retracement level. This level got rejected 3 consecutive times along with the 200 Exponential Moving Average. Besides, on the first strong pullback, the price bounced off the Fibonacci support, EMA as well as the top of the descending channel at the same time. This shows that the 171 satoshis area is still acting as the key demand zone.
On the other hand, the key resistance area or supply zone has been formed between 359 and 371 satoshis, which is confirmed by 127.2% Fibonacci retracement level. Overall, while trend remains bullish, the price can be expected to move up, potentially towards the 359 satoshis resistance area.
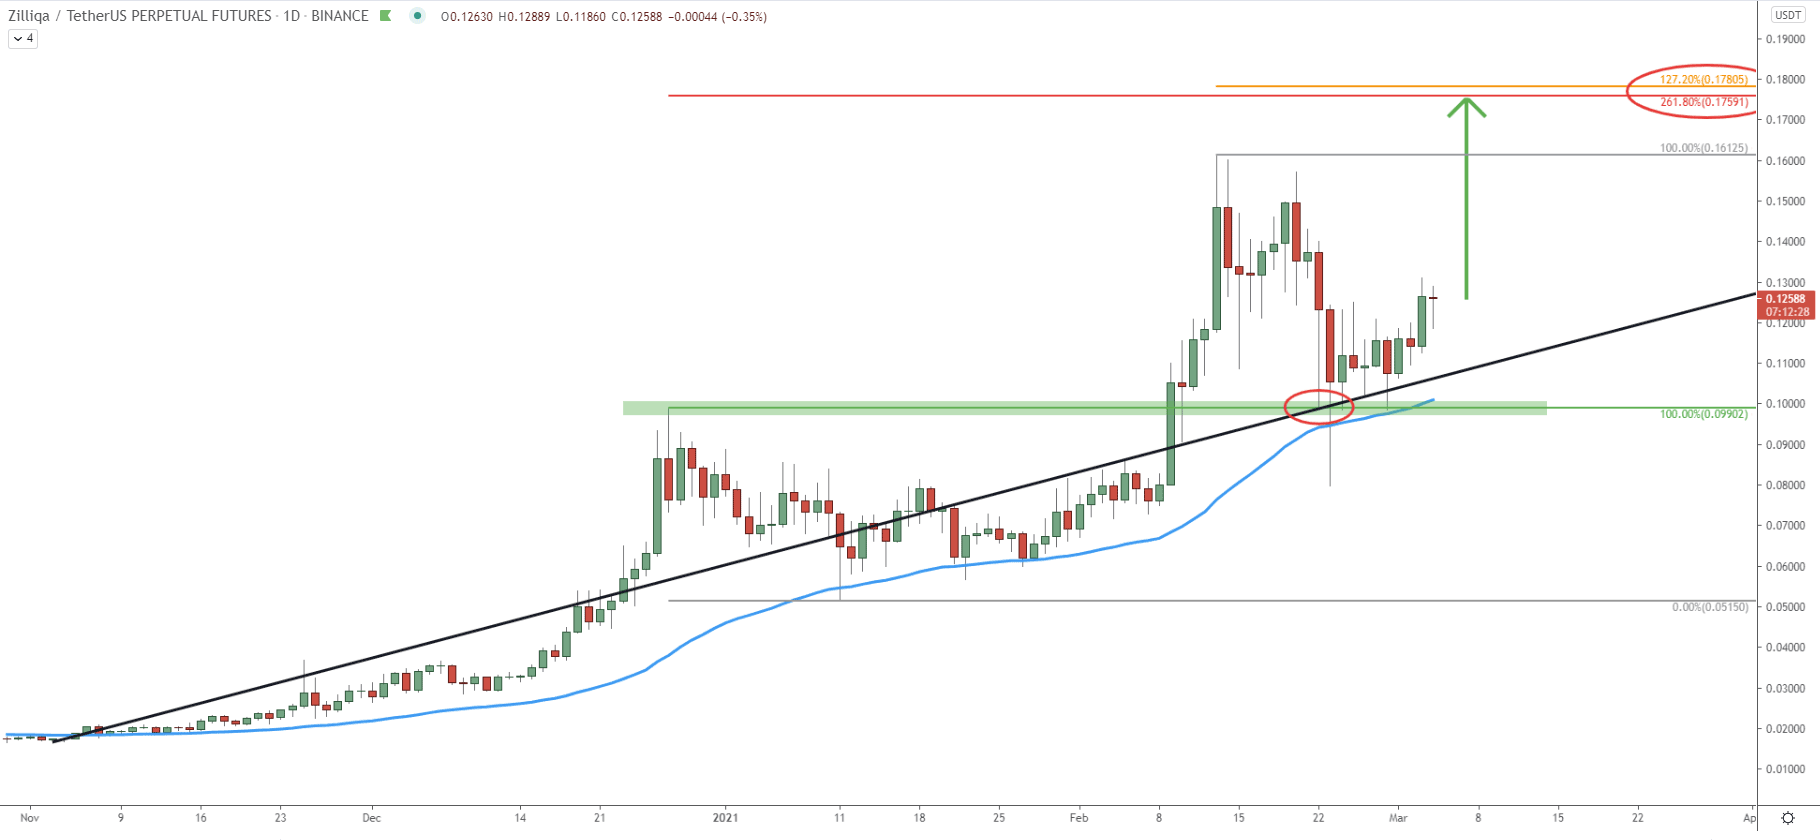
Moving on to the ZIL/USDT daily chart, it can be also spotted that price is clearly in an uptrend while producing higher highs and higher lows. At the end of February, Zilliqa found support at the previous level of resistance. This is the 0.1$ level which is an extremely strong psychological support. But price bounced off not only from this level but also from the average-price uptrend trendline as well as the 200 EMA. After this, high highs and higher lows are starting to appear on the lower timeframes, suggesting that the long-term uptrend is about to continue.
The nearest upside target and resistance are located between two Fibonacci retracement levels, specifically 261.8% and 127.2%, as can be seen on the chart. These Fibs were applied to the previous two corrective moves down, and show that the resistance is between $0.175 and $0.178. Considering that the trend is strongly bullish, it would be reasonable to assume that the $0.17 resistance area could be tested within a relatively short period of time.
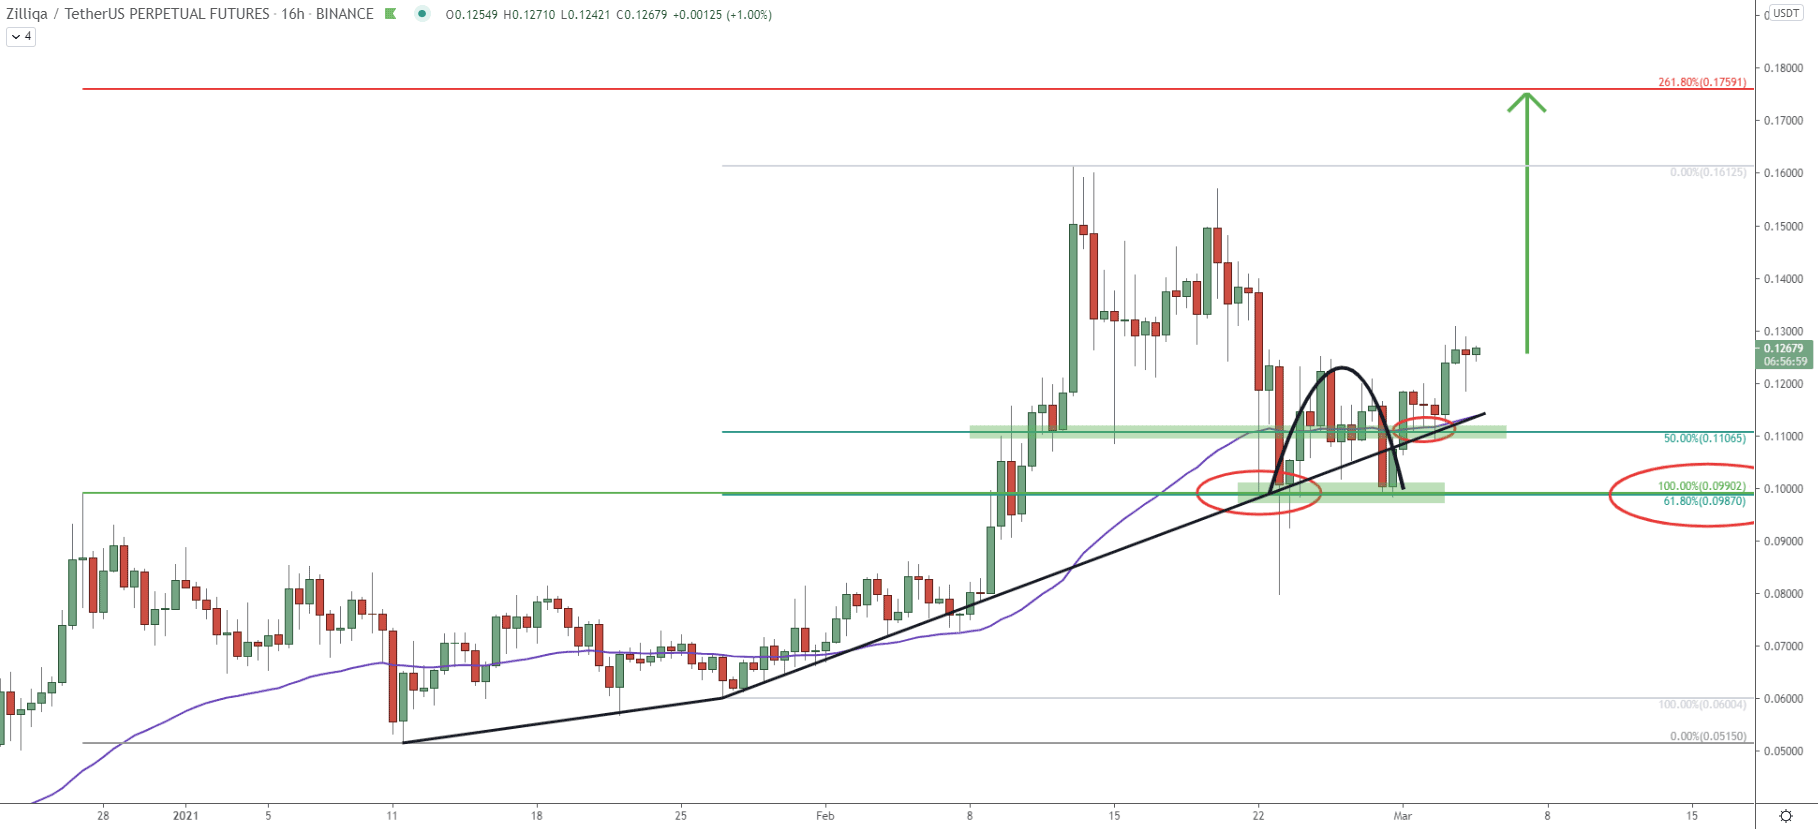
On this chart yet again we can see the importance of the $0.1 support, which on this chart corresponds to the 61.8% Fibonacci retracement level. It was rejected cleanly along with the simple uptrend trendline. Then price has produced a double bottom and broke above the 200 EMA. The most recent price action shows, that 50% Fibs at $0.11 has been acting as the support and was rejected along with the uptrend trendline and 200 EMA. Therefore, as long as the daily closing price remains above $0.11 and/or $0.10, bulls will have complete control over the price of ZIL/USDT.
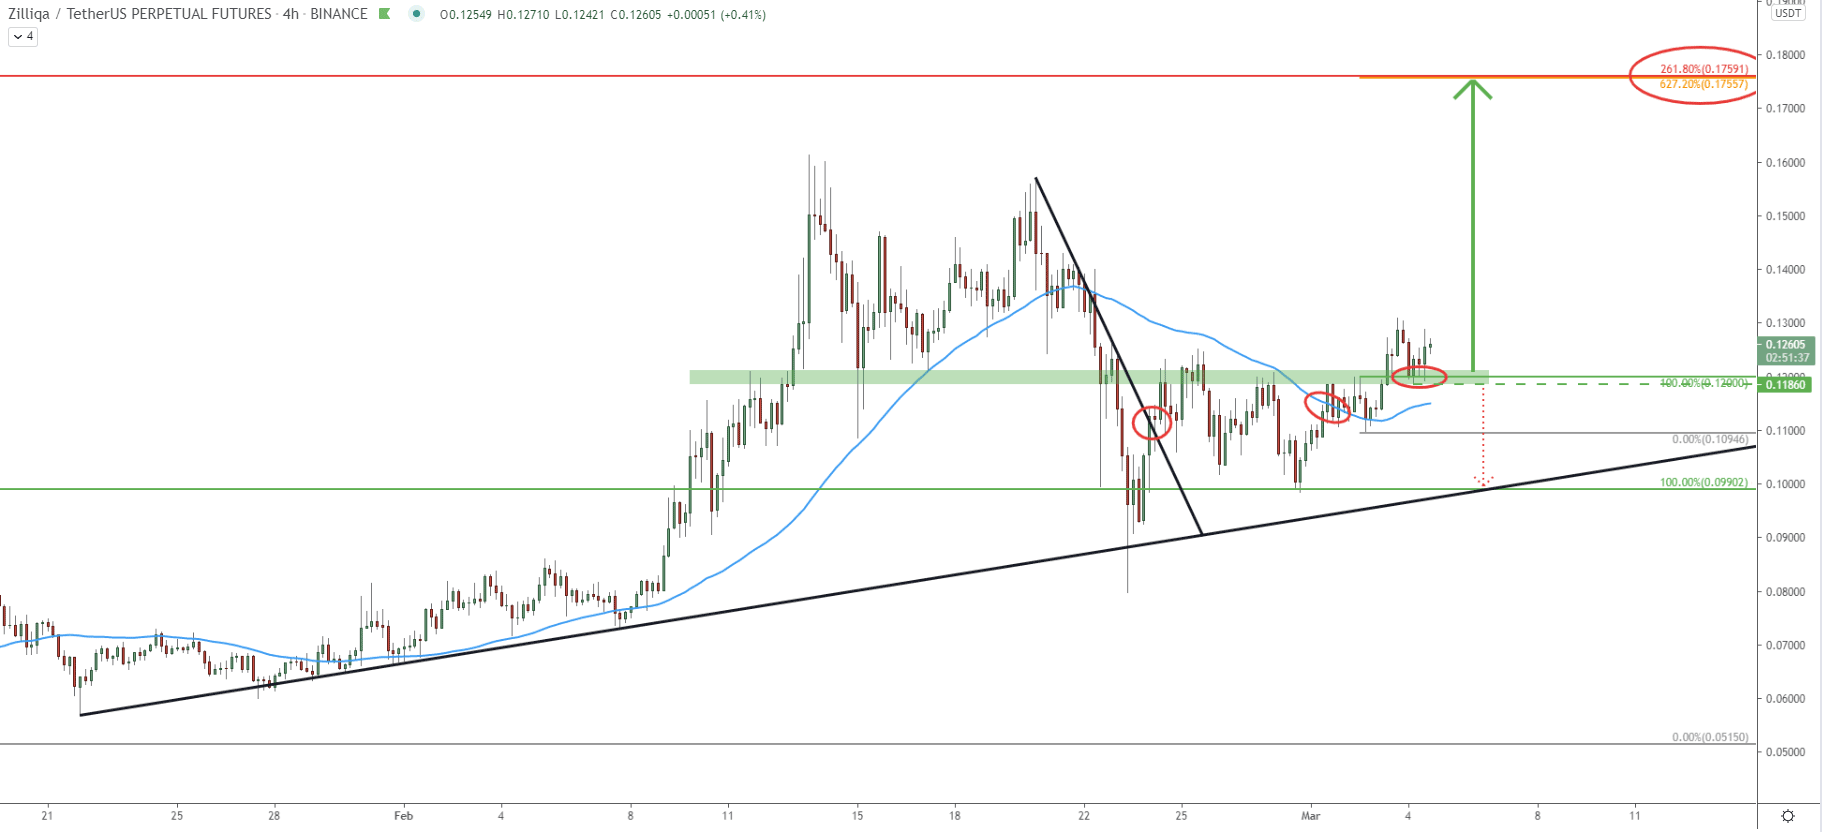
Clearly, the price is starting to show strong bullish signs. Yet another uptrend trendline got rejected after which ZIL broke above the downtrend trendline followed by the breakout of the 200 EMA. A few days ago, ZIL/USDT price bounced off the 200 EMa and it seems that the support has been formed near $0.12. This might imply that the price is ready to move up from this point onwards, however, based on the previous charts, the key support remains at $0.10. So the most important for the uptrend to continue is that the daily closing price remains above $0.10.
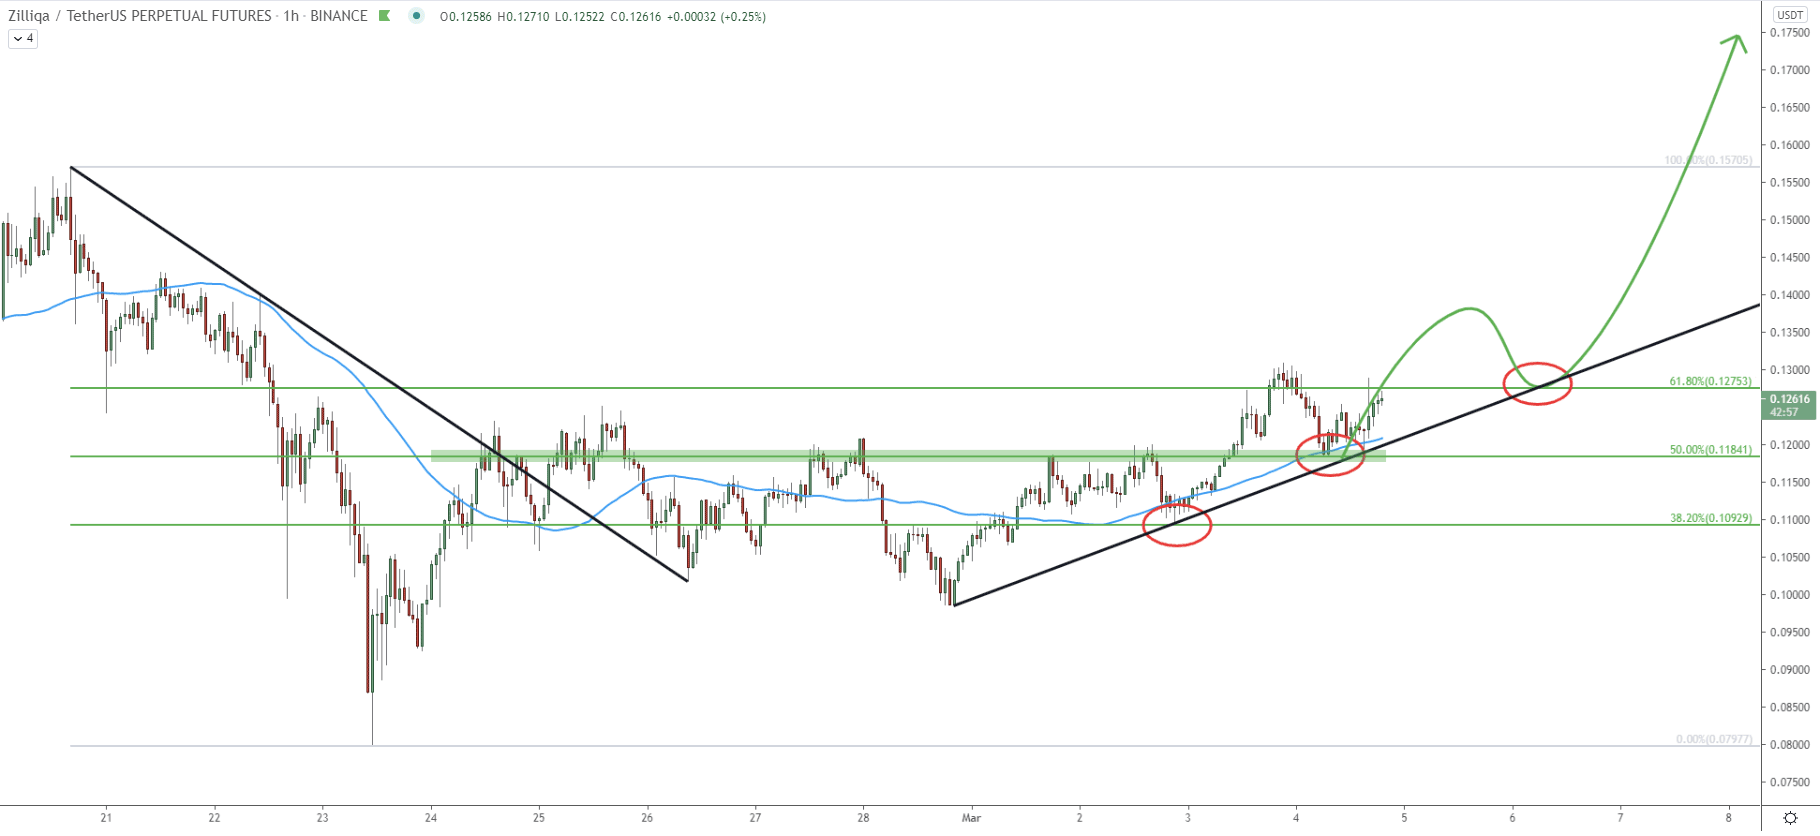
On the hourly chart, the price is printing higher highs and higher lows. The last two lows were formed on a price bounce off the Fibonacci support level. The first was 38.2% Fibs at $1.09, while the second was 50% Fibs at $0.118. As long as the uptrend trendline is being respected, the continuation of the uptrend can be expected at a fast phase. Although if the price will break below the $0.118 support, the $0.109 level is likely to be tested, prior to the uptrend continuation.
Zilliqa coin price action remains very bullish, against Bitcoin as well as the USDT. It seems like the correctional phase is over and during this or next week, the price is likely to start trending up.
As per the Daily chart, the key resistance is located at $1.17, which implies a potential growth of 50-70% in the coming days or weeks.
At this stage probability of the downtrend remains very low, and as long as $0.1 psychological support is being respected, bulls will continue to dominate. But, daily break and close below $0.1 support, will invalidate bullish outlook and in this scenario, a further price drop is likely to take place.
Support: 0.11, 0.10
Resistance: 0.16, 0.17


