
Published: May 18th, 2022
ZCash started 2022 with a strong buying pressure where the ZEC/USDT price surged 164% from 81.9 swing low to 216.8 swing high. However, bulls failed to hold the momentum, and sellers' dominance appeared following the broader crypto market crash. As a result, ZEC/USDT plunged 67%, where the recent liquidity grab below 81.60 is the major hope for bulls.
Zcash offers a decentralized environment where people can maintain better privacy and anonymity by making transactions. It uses the zk-SNARK zero-knowledge proof technology where the transaction is verified without exposing any sensitive information of users. Furthermore, unlike other cryptocurrencies, ZCas does not show senders' and receivers' addresses and amounts until a legal issue arises.
ZCash started its operation on 28 October 2016, where the original base was Bitcoin’s codebase. Let’s see the future price direction of ZCash (ZEC) from the ZEC/USDT technical analysis.
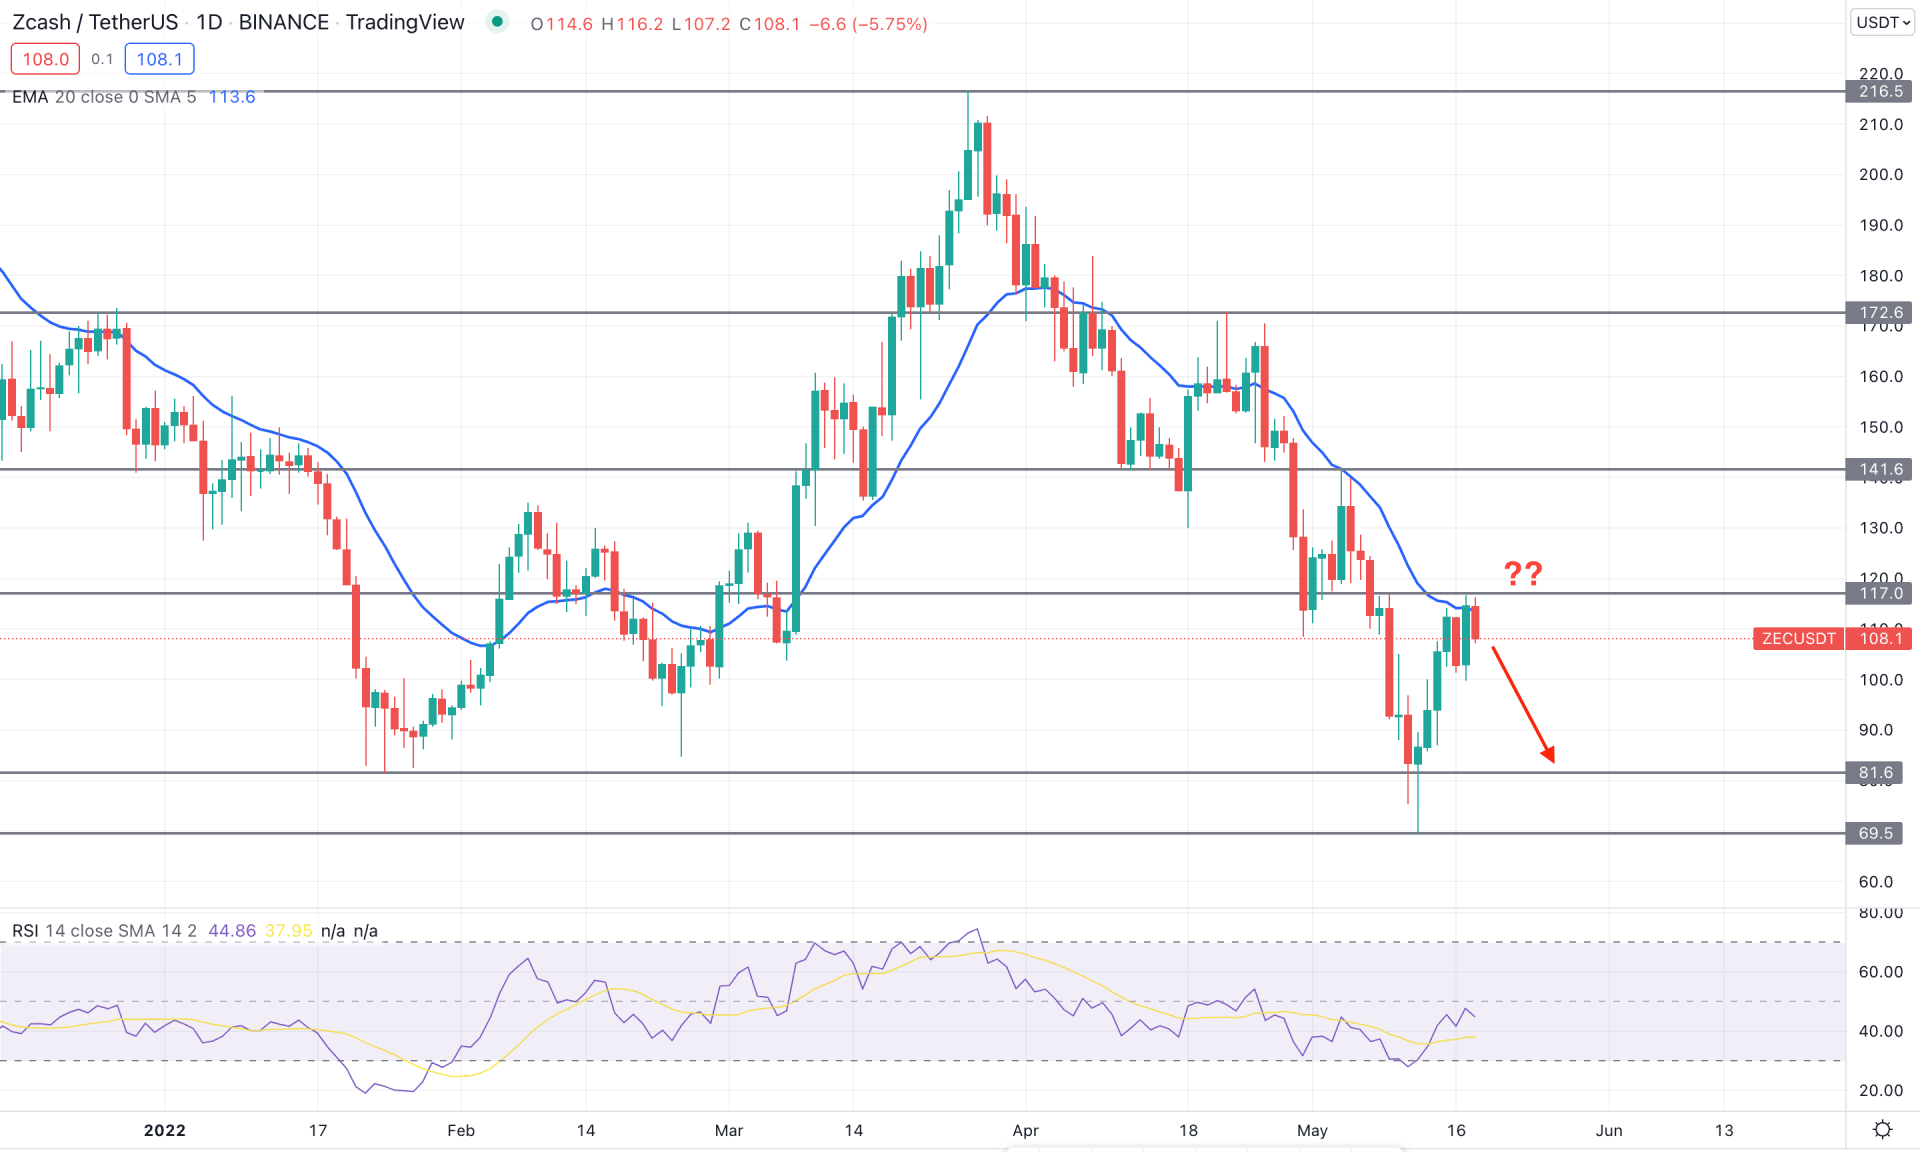
In the daily chart, ZEC/USDT price showed an amazing recovery from the 81.60 swing low, indicating that the price has grabbed the sell-side liquidity before showing another bullish swing towards the 218.50 high. The broader bearish pressure from March 2022 high halted moving lower by forming a ground at the 69.50 level, where the formation of the demand zone awaits confirmation with a bullish break of structure. In that case, bulls should wait for a new swing high above the 117.00 double top pattern that would be the first sign of the upcoming buying pressure.
The above image shows that the Relative Strength Index rebounded from the oversold 30 level and reached near the neutral 50 areas, indicating an indecisive momentum. However, the price faced resistance from the 117.00 static level while the dynamic 20 EMA remained closer. Therefore, as bulls are facing a strong barrier, any sign of selling pressure in the intraday chart would be a bearish opportunity.
Based on the daily chart, bulls should wait for the price to move above the 117.00 level with a daily close before considering it a buy. On the other hand, as the price is facing major resistance, any sign of selling pressure may lower the price towards the 81.60 level.
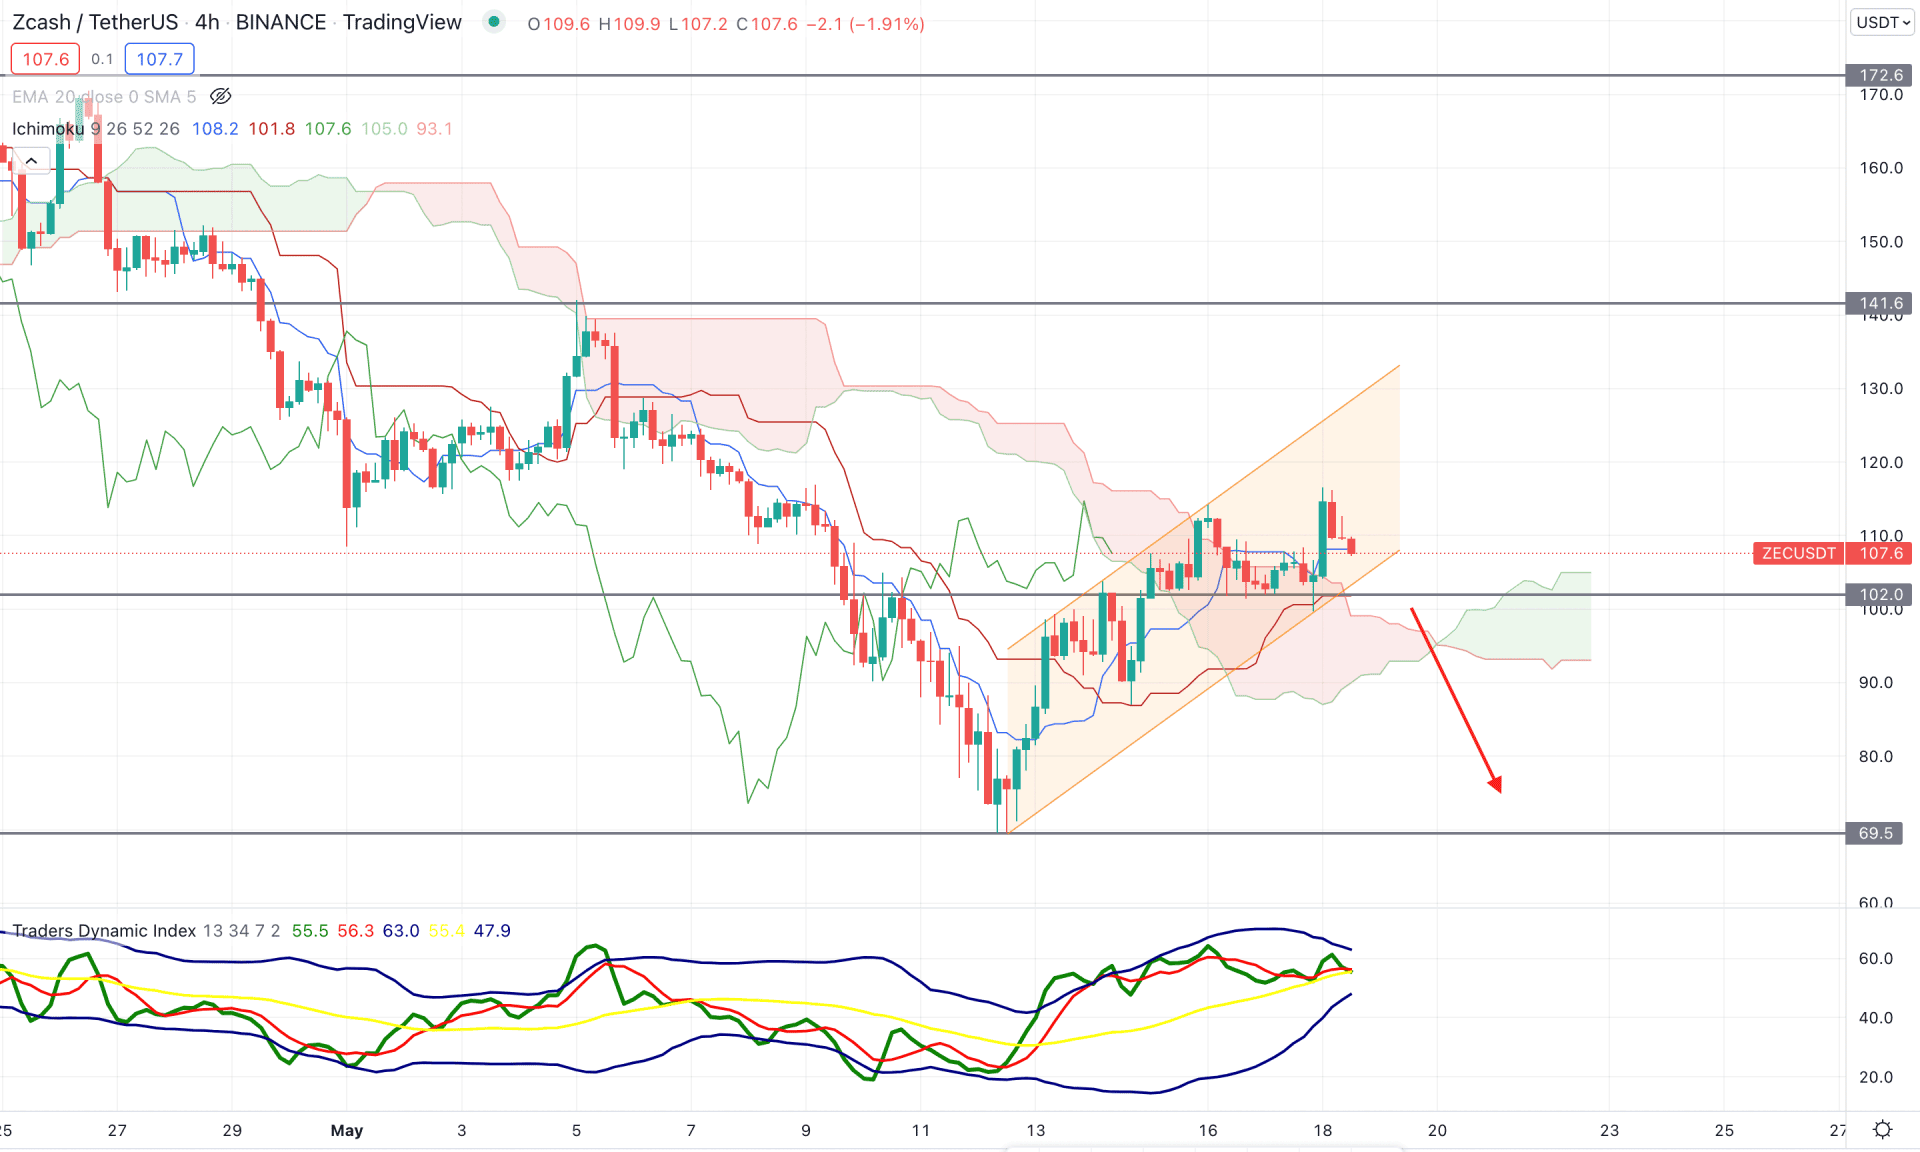
According to the Ichimoku Cloud analysis, the current price is trading above the Kumo Cloud, followed by a corrective breakout. In the future cloud, Senkou Span A remains above Senkou Span B, indicating buyers' presence in the price. On the other hand, the lagging span remained above the price, but the price action seems corrective.
The above image shows that the Traders Dynamic Index, an effective tool to measure buyers' and sellers' dominance in the market, remains in the upper band. It signifies that bulls are more aggressive in the market than bears, which will remain active until the TDI line moves below the 50 level. Meanwhile, a bullish crossover between Tenkan Sen and Kijun Sen may work as a bullish factor in the H4 chart.
Based on the current findings, the bullish momentum may extend if the price shows another bullish rejection from the dynamic Kijun Sen. on the other hand, a break below the 102.00 intraday static support level with a bearish H4 close would lower the price towards the 69.00 area.
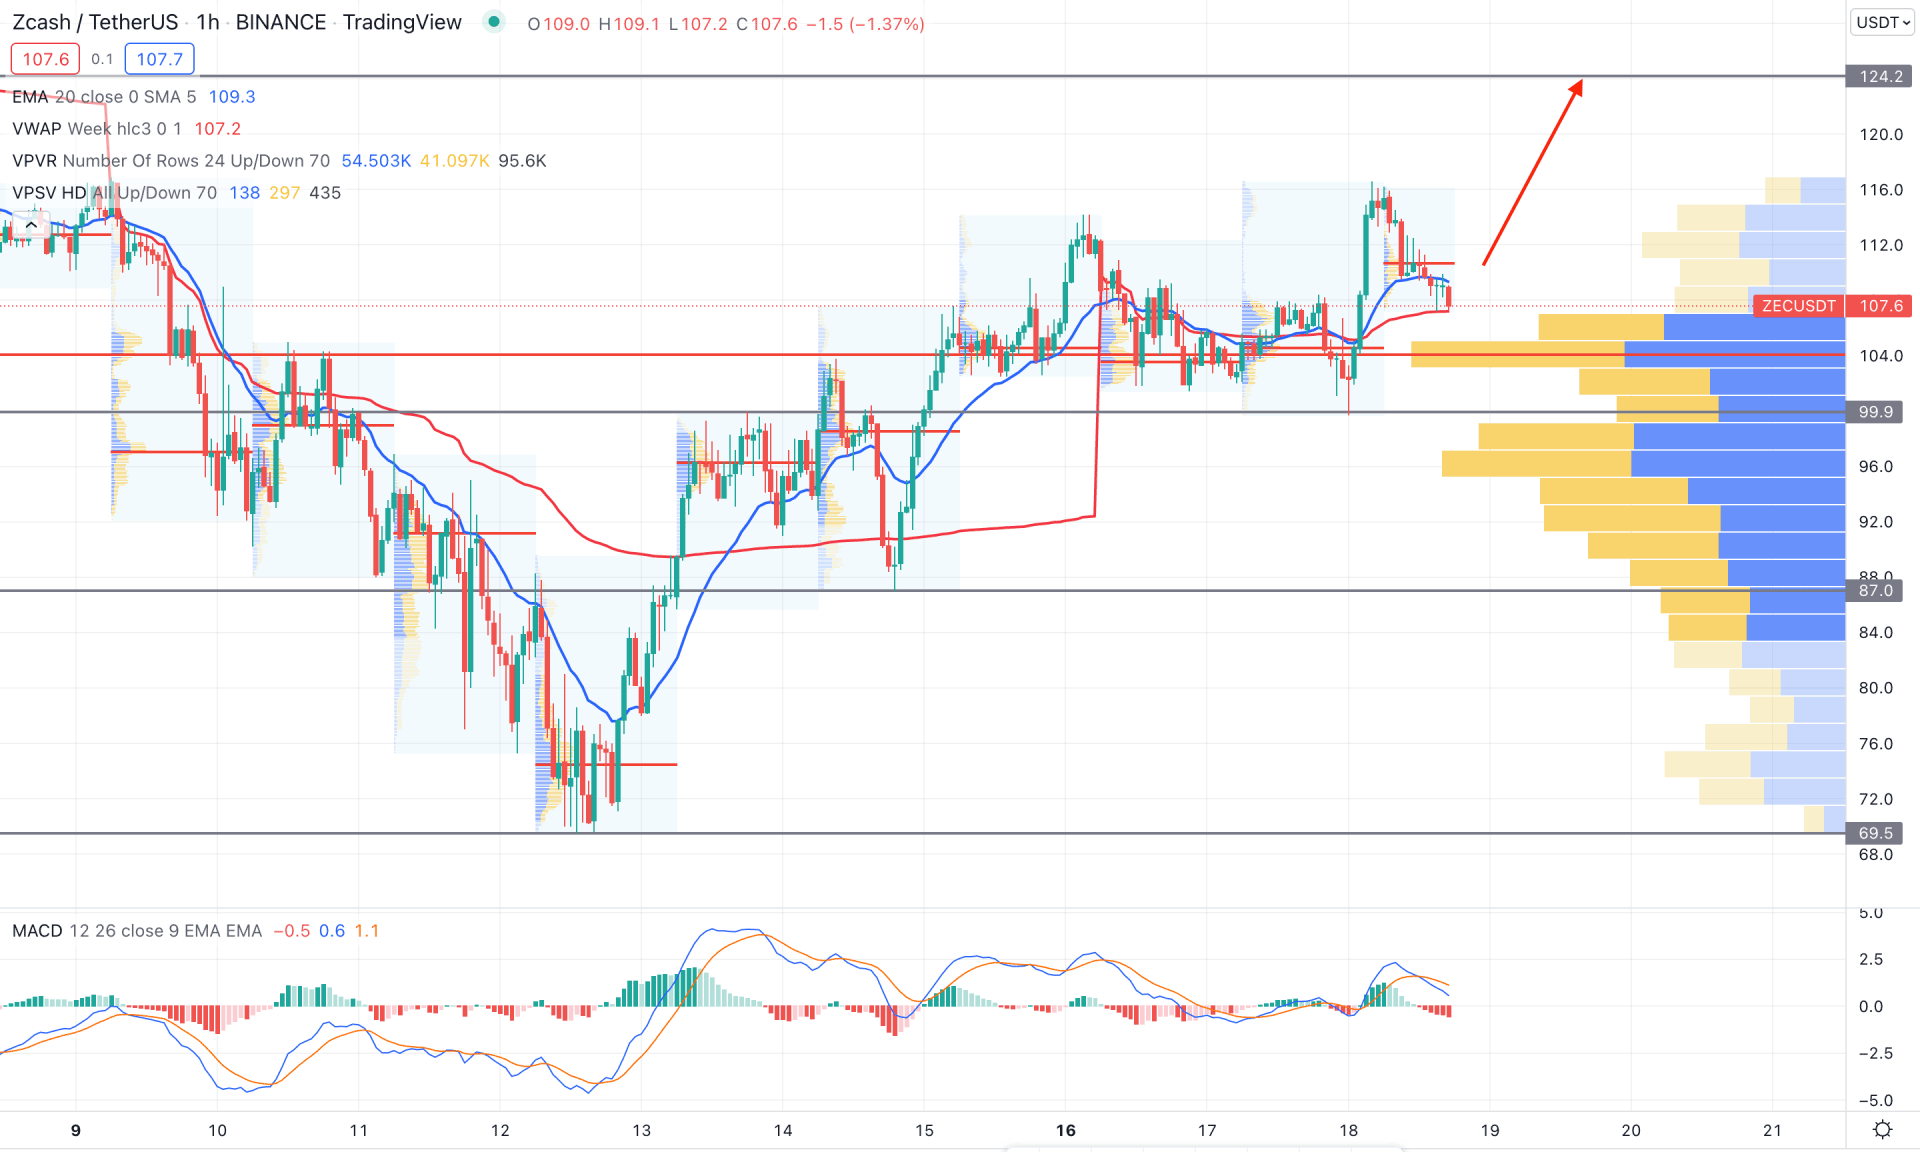
In the intraday chart, the ZEC/USDT price is trading within an upward momentum where the current price is corrective at the dynamic 20 EMA support. Moreover, the most recent high volume level remains above the price as the maximum volume from the visible range came at 103.70 level. In that case, any bullish rebound with an H1 close above the dynamic 20 EMA would increase the buying pressure for this pair.
The above image shows the H1 chart on ZEC/USDT, where the MACD Histogram is strongly bearish. Moreover, there is a divergence between the MACD lines and price with a bearish crossover in the MACD Line. Meanwhile, the current price still trades above the dynamic weekly VWAP level, where a break below this level would increase the selling pressure.
Based on the H1 chart, bears are more likely to take the price down towards the 87.00 support level if the price shows a bearish H1 close below the 104.00 high volume level. On the other hand, an immediate rebound from the current price with a bullish H1 close above the dynamic 20 EMA would resume the current bullish pressure towards the 124.20 resistance level.
As per the current market context, ZEC/USDT is more likely to move down as long as it trades below the 117.00 key resistance level in the daily chart. Investors should closely monitor the intraday price action to match the daily chart’s direction.


