
Published: December 10th, 2025
The privacy-focused cryptocurrency Zcash has released a new concept for a dynamic fee structure intended to keep users from being priced out of the network by skyrocketing transaction prices. The suggestion, which was released by the research team Shielded Labs, responds to growing worries about mounting fees as Zcash encounters greater utilisation and network congestion.
Zcash has depended on a fixed transfer fee structure since its 2016 introduction, which initially started at 10,000 zatoshi and then lowered to 1,000 zatoshi in order to handle an expanding user base. Zcash was appealing to new users because of its simplicity, which kept transactions simple and affordable.
A stateless, dynamic charge mechanism based on the average fee of the final 50 blocks is introduced in the new proposal. In order to streamline the structure and reflect network conditions, charges will be adjusted to powers of ten.
The objective is to improve fee certainty for both dealers and validators while maintaining the network's safety and privacy guarantees. Zero-knowledge proof builders, protocol executives, and human rights advocates will attend a discussion on financial monitoring and anti-money laundering regulations that the SEC's Crypto Task Force has scheduled.
Let's see the further aspect of this coin from the ZEC/USDT technical analysis:
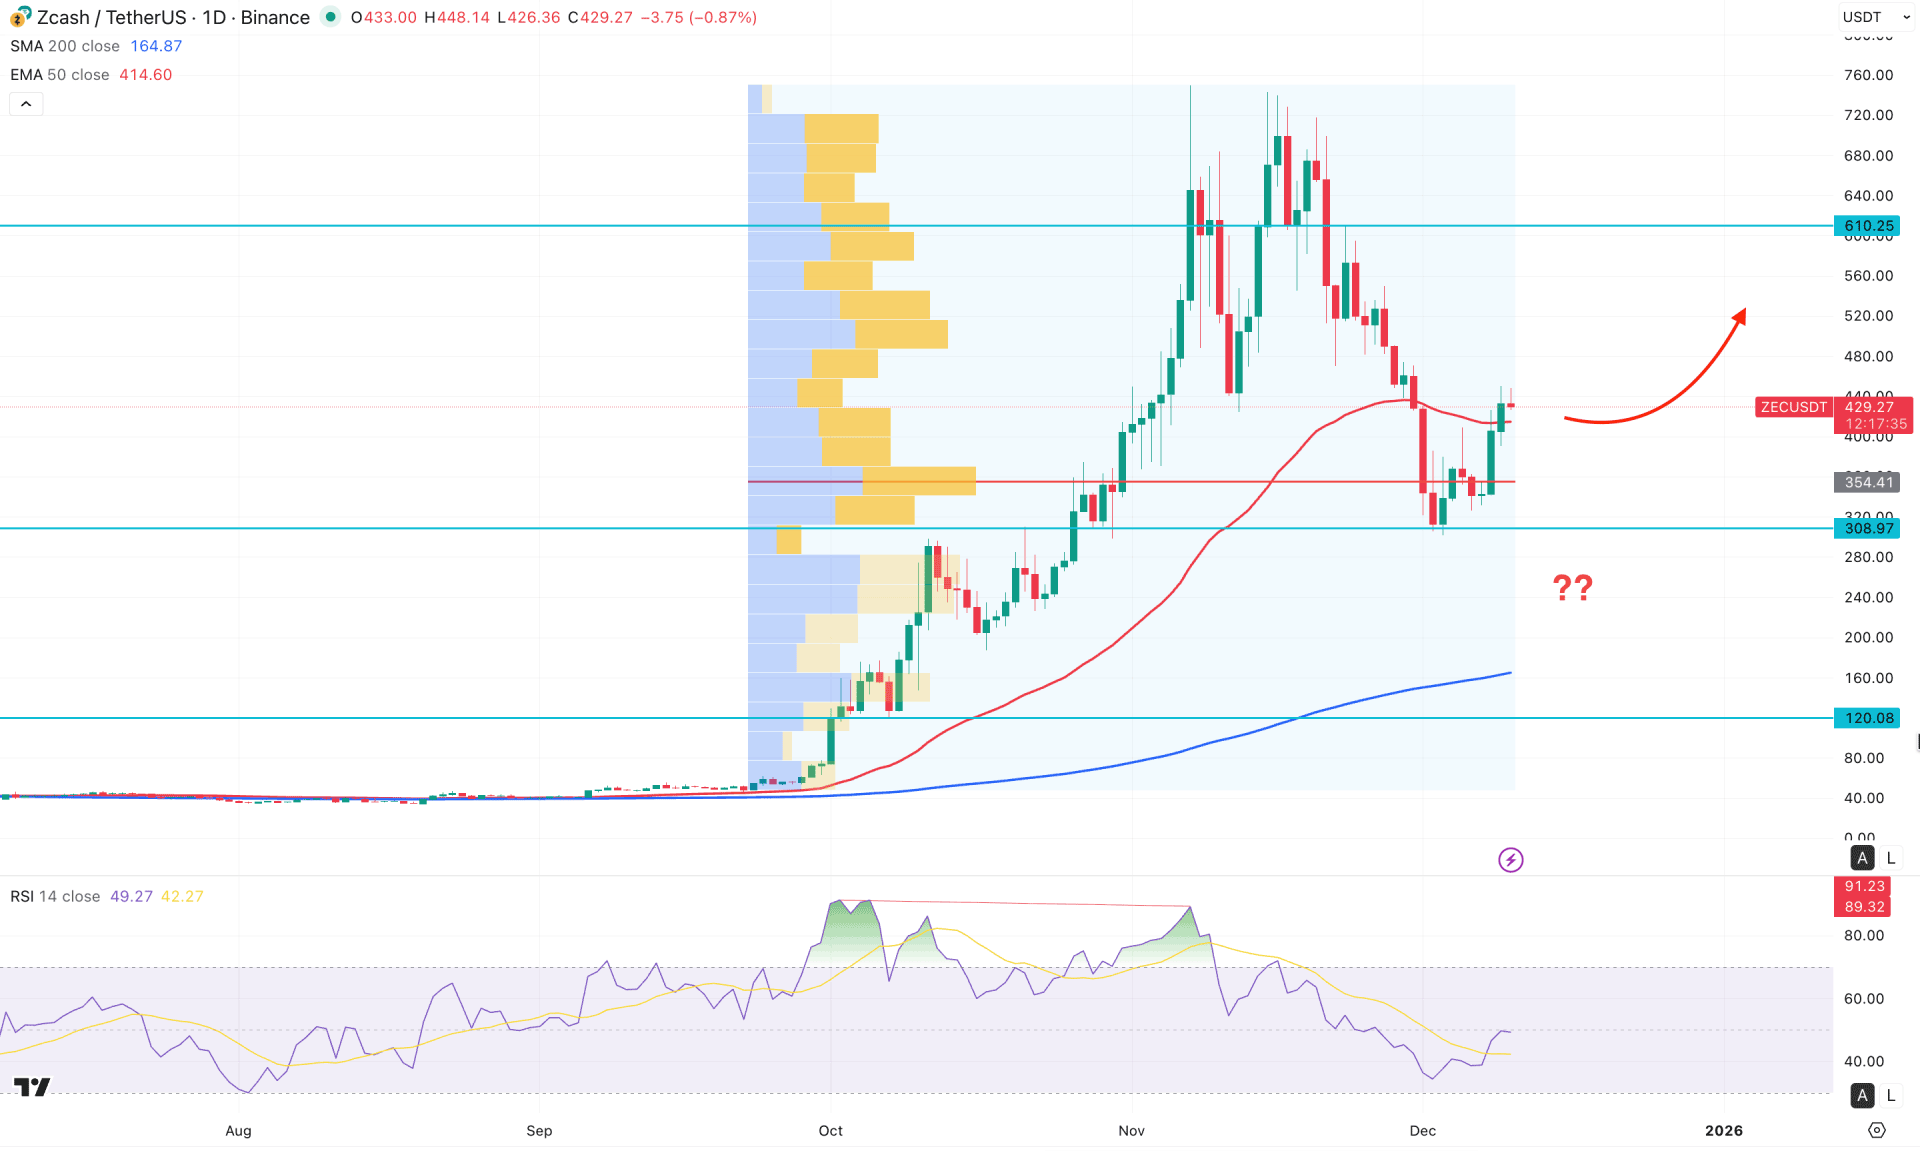
In the daily chart of ZEC/USDT, the major market momentum is bullish, even if there is a strong rebound from the all-time high area. As the recent price has created a bottom with a valid rebound, investors might consider a bullish continuation opportunity soon.
In the higher timeframe, the monthly chart suggests extensive volatility, where no strong bearish rebound is visible. The price grabbed sufficient sell-side liquidity from the November 2025 low and rebounded higher. The weekly price shows the same structure, where the current weekly candle is hovering near the 429.03 resistance level. A valid close above this line could be a potential reversal signal, opening a bullish continuation opportunity.
In terms of the volume, the price is trading in the buyers' zone, as a valid rebound above the high volume line is present. Primarily, a bullish trend trading opportunity might be open as long as the high volume line is protected below the current price.
In the main price chart, the 200-day Simple Moving Average is below the current price, working as a major support. Moreover, the 50-day Exponential Moving Average is just below the current price, working as an immediate support. Primarily, the major anticipation for this pair is to look for long trades as both dynamic lines are holding the buying pressure.
On the other hand, the Relative Strength Index (RSI) has tested the oversold 30.00 line before moving beyond the 40.00 line. Although the current RSI line is in the selling territory, investors might find a bottom validation after overcoming the 50.00 neutral line.
Based on the overall market structure, ZEC/USDT has a higher possibility of forming a bullish continuation signal from the current price area. The ultimate target of the bull run would be toward the 610.25 level before creating a new all-time high.
On the other hand, investors should closely monitor how the price holds the buying pressure above the 50-day Exponential Moving Average area. Any immediate selling pressure with a daily close below the 308.97 level might invalidate the bullish opportunity. In that case, the price might dip lower and find support at the 120.03 level.
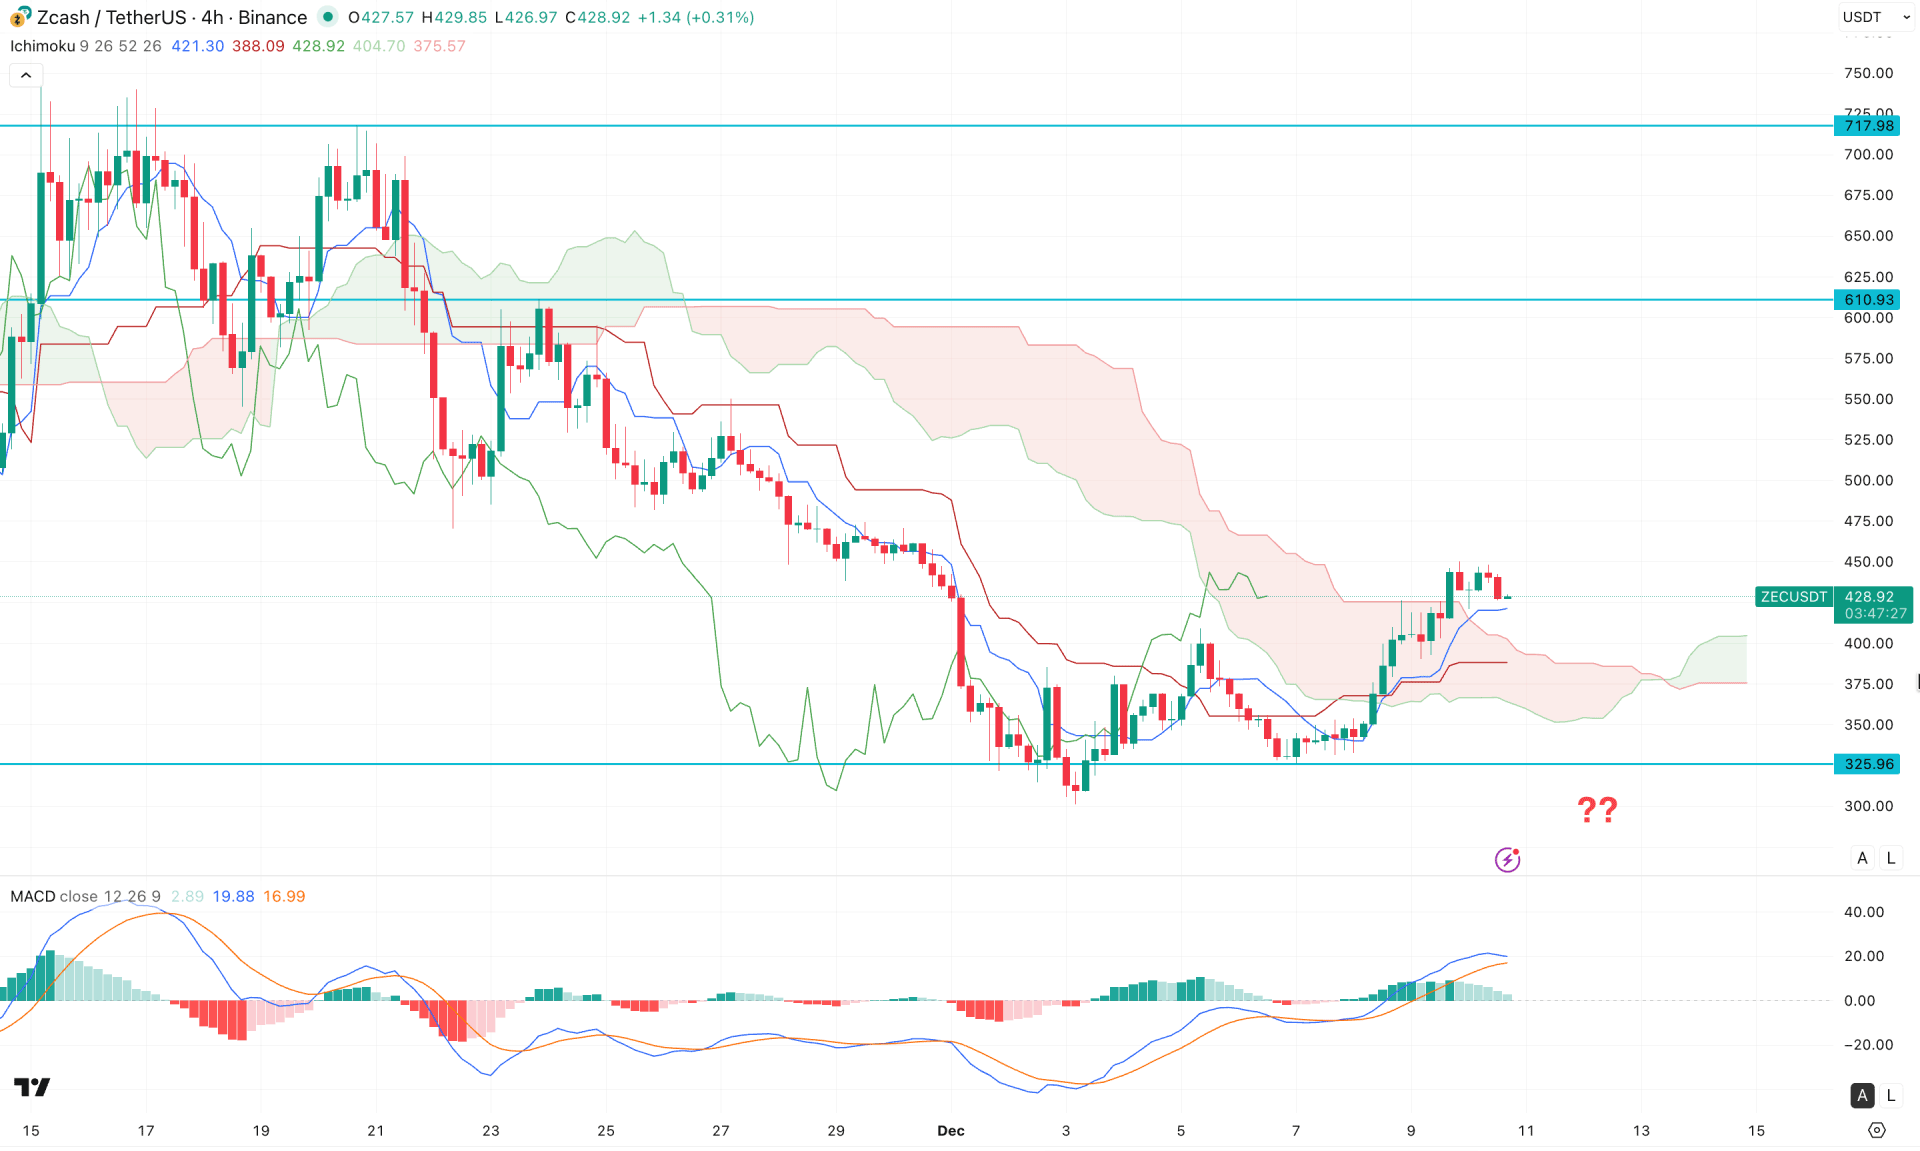
In the H4 timeframe, the recent price is trading sideways near the bottom, creating a potential rebound opportunity. Although the price has moved above the cloud area, there is no clear sign of a bullish continuation. However, the future cloud looks optimistic as both lines have flipped positions, forming a strong base structure.
In the secondary indicator window, the MACD histogram suggests a possible downside correction as the recent line is squeezing toward the neutral area, accompanied by a top formation in the signal line.
Based on this outlook, an immediate bearish signal with a four-hour candle closing below the 375.00 level could open a short opportunity targeting 300.00. Moreover, a break below the 325.96 support level could provide further downside potential toward the 200.00 psychological area.
On the other hand, investors should wait for a solid range-bound structure above the cloud area before anticipating a test of the 610.93 resistance level. A possible range with a liquidity sweep, followed by a bullish rebound from the key demand zone, could extend the bullish momentum beyond the 77.98 resistance level.
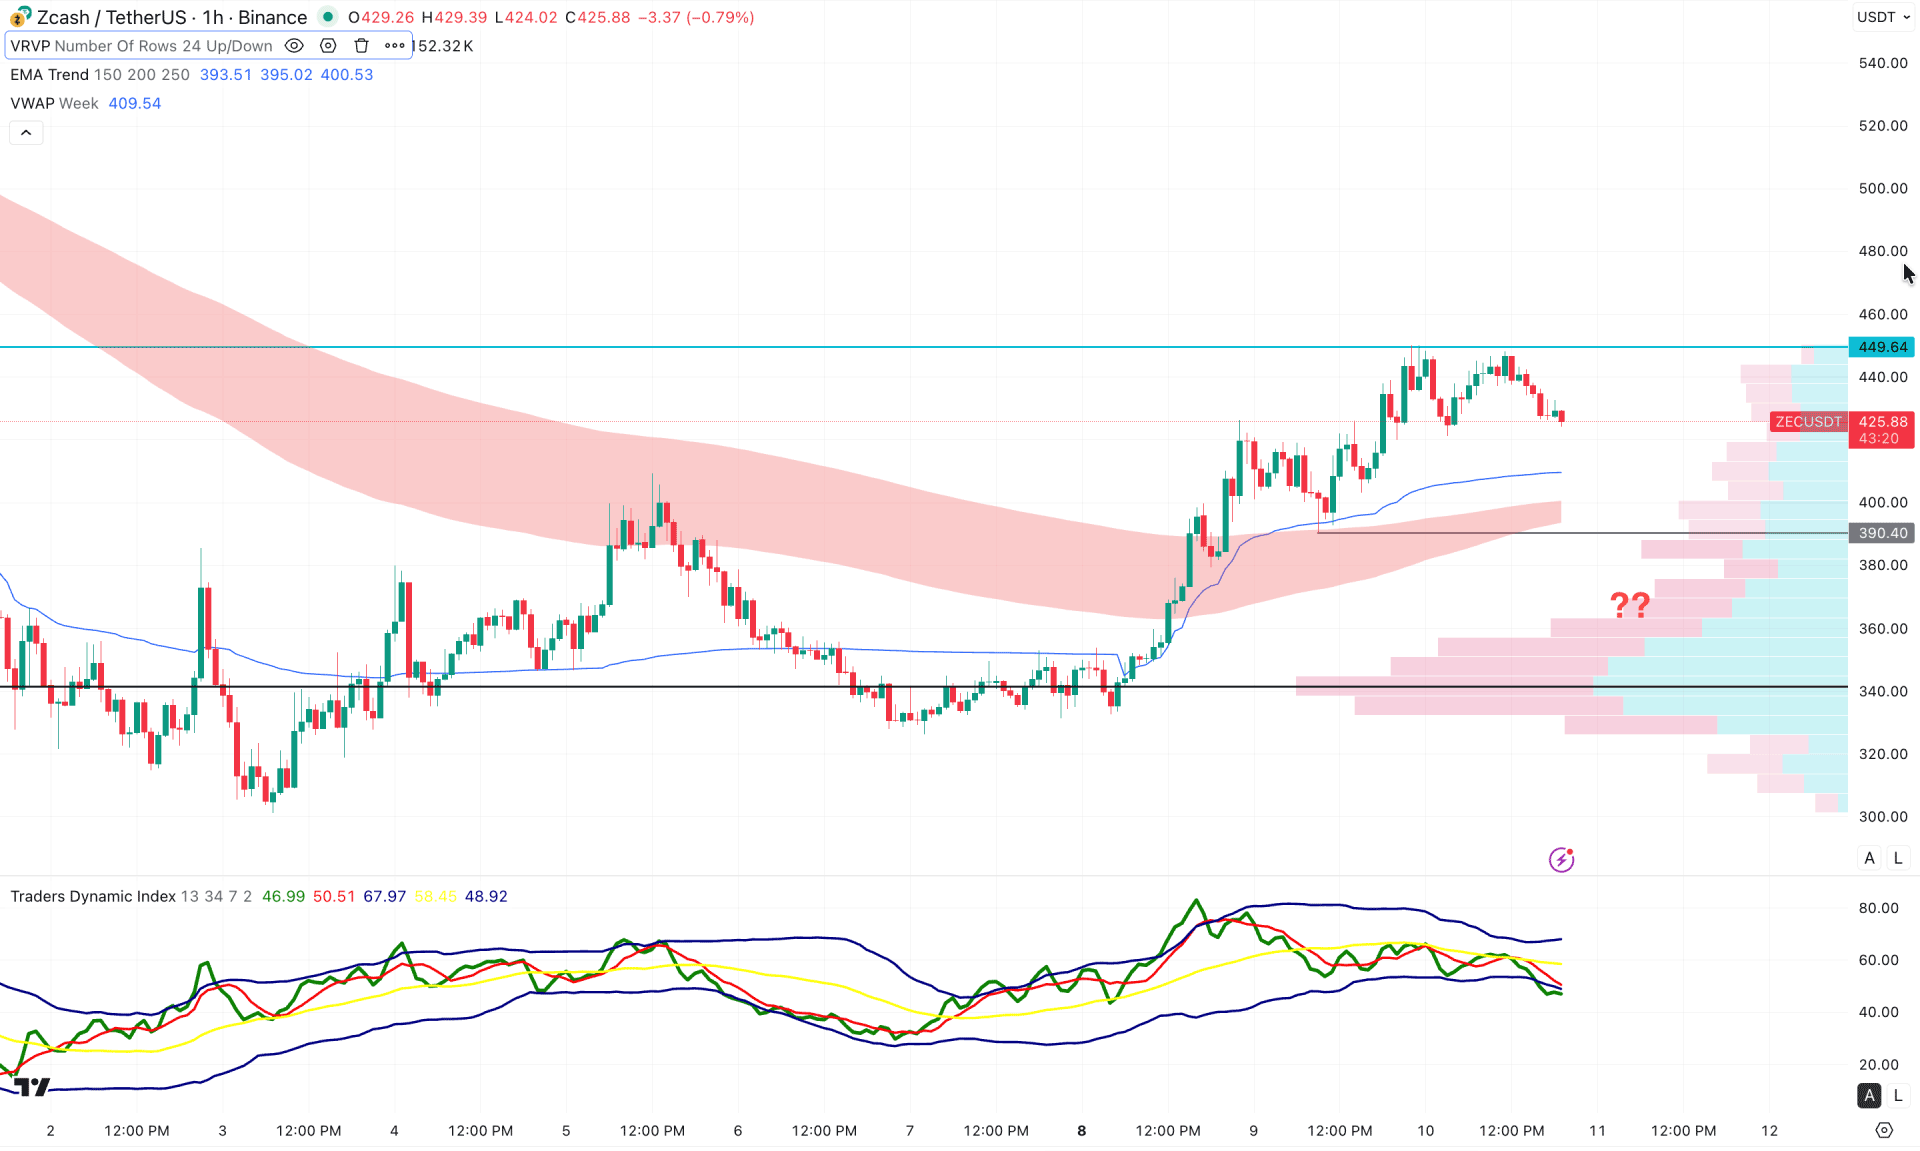
In the hourly timeframe, the recent price is trading at the intraday high, suggesting a pending downside correction. Moreover, the Exponential moving Average wave and intraday high volume lines are below the current price, working as a major barrier.
In the indicator window, the Traders Dynamic Index (TDI) is hovering at the lower band area, suggesting a potential bottom formation in the main chart.
Based on this outlook, the main intraday anticipation for this pair would be to look for short opportunities as long as the 449.64 intraday resistance is protected. On the bearish side, the immediate support is located at the 390.40 level, which needs to be overcome before entering the buy zone.
Any potential bullish reversal from the 380.00 to 340.00 zone with a bullish H1 candle above the dynamic VWAP line could be a potential long opportunity.
Based on the overall market structure, ZEC/USDT has a higher possibility of extending the bullish pressure. However, the extended volatility and the intraday top formation could influence investors to join the bullish rally from a discounted price zone.


