

Published: October 21st, 2026
Zcash (ZEC) climbed back above $1,200 as anticipation builds around its upcoming NU7 network upgrade. A newly released report also points to sustained growth across the Zcash network.
Zcash Open Development Lab has set November 6 at 00:50 GMT for the final mainnet activation decision on the NU7 upgrade. The planned changes aim to cut block confirmation times from 75 seconds to 25 seconds, making confirmations three times faster.
The upgrade will also phase out the legacy v4 transaction pool, affecting ZEC holdings in the Sprout shielded pool, and introduce the Network Sustainability Mechanism (NSM). Under this mechanism, 60% of transaction fees will be allocated to the NSM Value Balance, while the remaining 40% will go to miners.
Institutional investment flows, meanwhile, show tentative signs of improvement after three successive weeks of heavy outflows. SoSoValue data indicates that Bitwise's ZEC-focused exchange-traded fund (ETF) attracted $1.61 million on Tuesday.
Weekly outflows have also moderated considerably, dropping from $93.56 million in early October to $19.15 million last week. This suggests institutional selling pressure may be losing momentum.
On the network front, Blockworks reported a 21% increase in transactions over the past three months, bringing the total to approximately 710,000.
Let's see the upcoming price direction from the ZEC/USDT technical analysis:
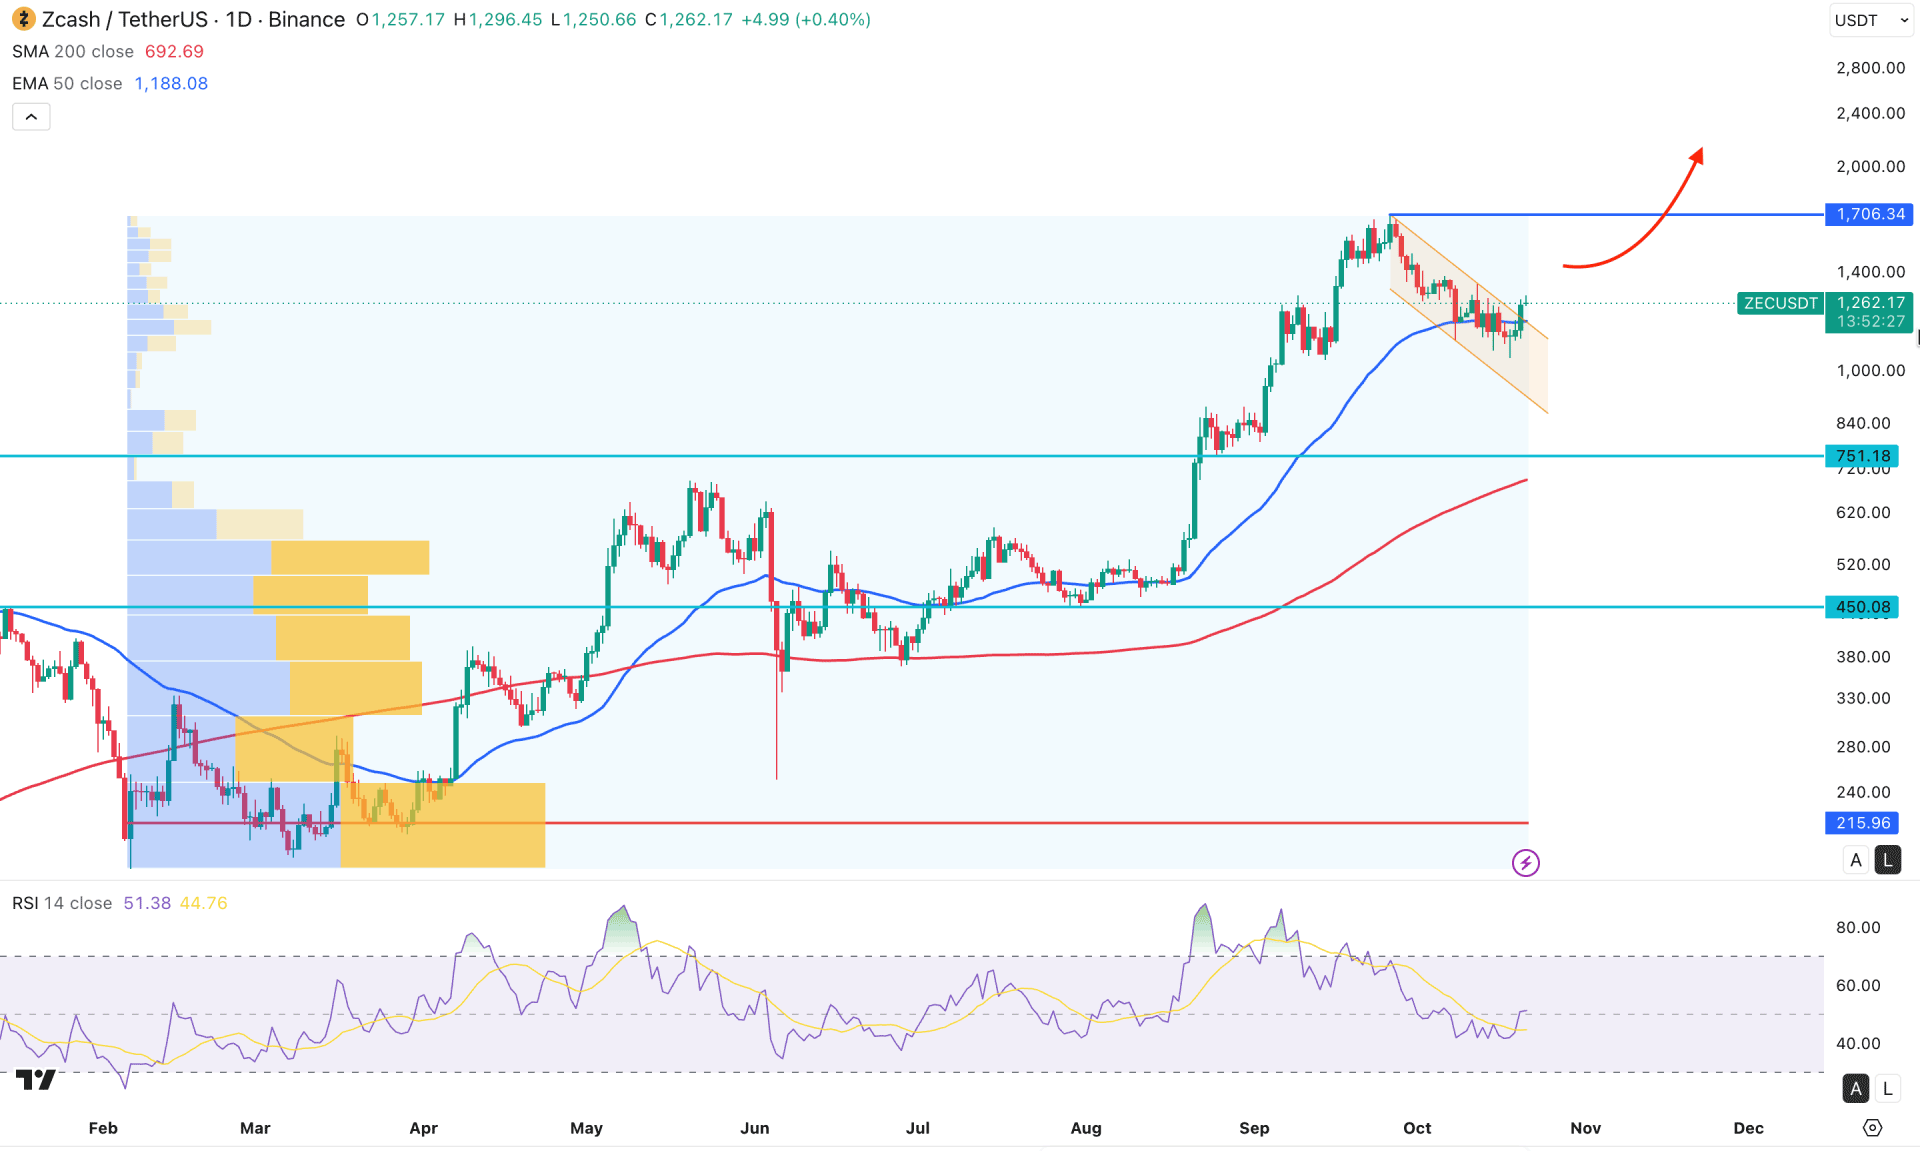
On the ZEC/USDT daily chart, the market shows ongoing bullish momentum. Price continues to rise and has created a new yearly high. There is no sign of exhaustion at the bottom. Overall, this signals stable bullish trend-continuation momentum, making it a potential opportunity for a trend-trading strategy.
On the higher time frame, price action is solid, with three consecutive bullish monthly candles after a strong liquidity grab. However, the current setup shows a bullish opportunity after overcoming the monthly flip zone. The weekly timeframe represents a corrective structure with three consecutive bearish closes. Price is now in a bullish rebound, but it needs proper validation.
The volume structure is positive for buyers, as the most significant level since February 2025 is below the current price. However, the high-volume line is way below the recent swing, signaling a decent downside correction possibility. Moreover, no significant high-volume activity is visible at the top, suggesting profit-taking rather than a bullish pump-and-dump.
In the main price chart, price is moving sideways at the 50-day EMA, while the 200-day SMA slopes below the 751.18 static support level. Primarily, a bullish rebound off the 50-day EMA signals a stable price rebound, where a higher bullish continuation is possible.
In the main price chart, price is currently sideways at the 50-day EMA, while the 200-day SMA slopes below the 751.18 static support level.
The Relative Strength Index indicator has rebounded and is currently hovering above the 50.00 neutral level. Overall, the RSI shows no clear direction, but the current divergence could offer a minor bullish rebound opportunity.
Based on the overall daily structure, a bullish rebound above the 50 EMA could increase the possibility of testing the 1706.34 resistance level. On the bearish side, an immediate rebound with a bearish daily close below 1061.53 could increase the chance of testing the 751.18 support level.
In that case, another bullish opportunity is present after testing the 200 SMA area. An extended downside correction toward the 450.08 level is possible if price fails to sustain buying pressure above the 200 SMA.
On the bearish side, an immediate rebound with a bearish daily close below 1061.53 could increase the chance of testing the 751.18 support level. In that case, another bullish opportunity could appear after testing the 200 SMA area. An extended downside correction toward the 450.08 level is also possible if price fails to sustain buying pressure above the 200 SMA.
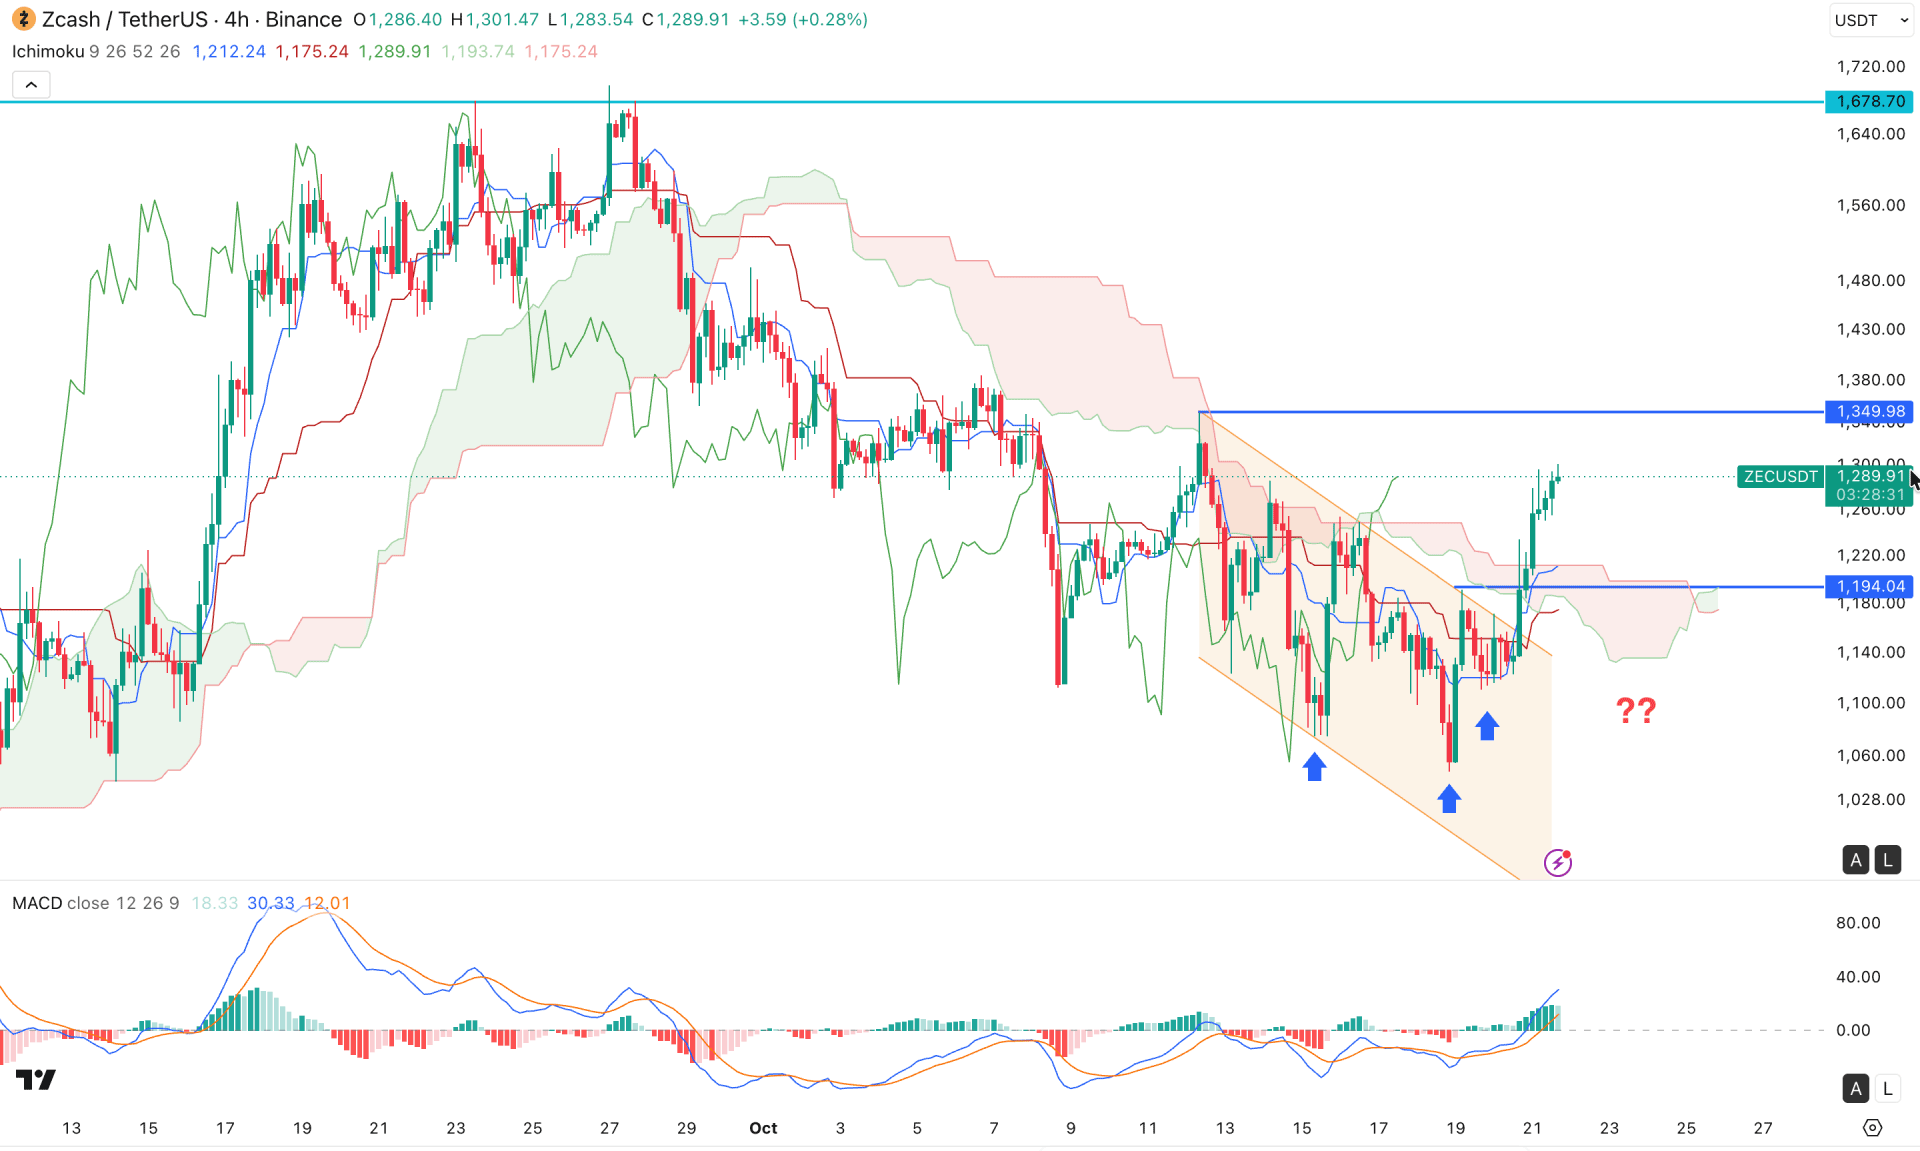
On the four-hour timeframe, ZEC/USDT is trading with a bullish structure, as price formed an inverse head-and-shoulders breakout and recovered above the cloud area. As a result, the future cloud has flipped position, signaling a bullish continuation.
In the secondary indicator window, the MACD histogram remains above the neutral area for a considerable time, where the signal line has moved beyond the bullish peak area.
Based on this structure, the price has rebounded from a bearish to a bullish position, though a considerable correction is pending before forming another bullish wave.
The immediate support level to watch is 1194.04, as buying pressure remains valid as long as price stays above this area.
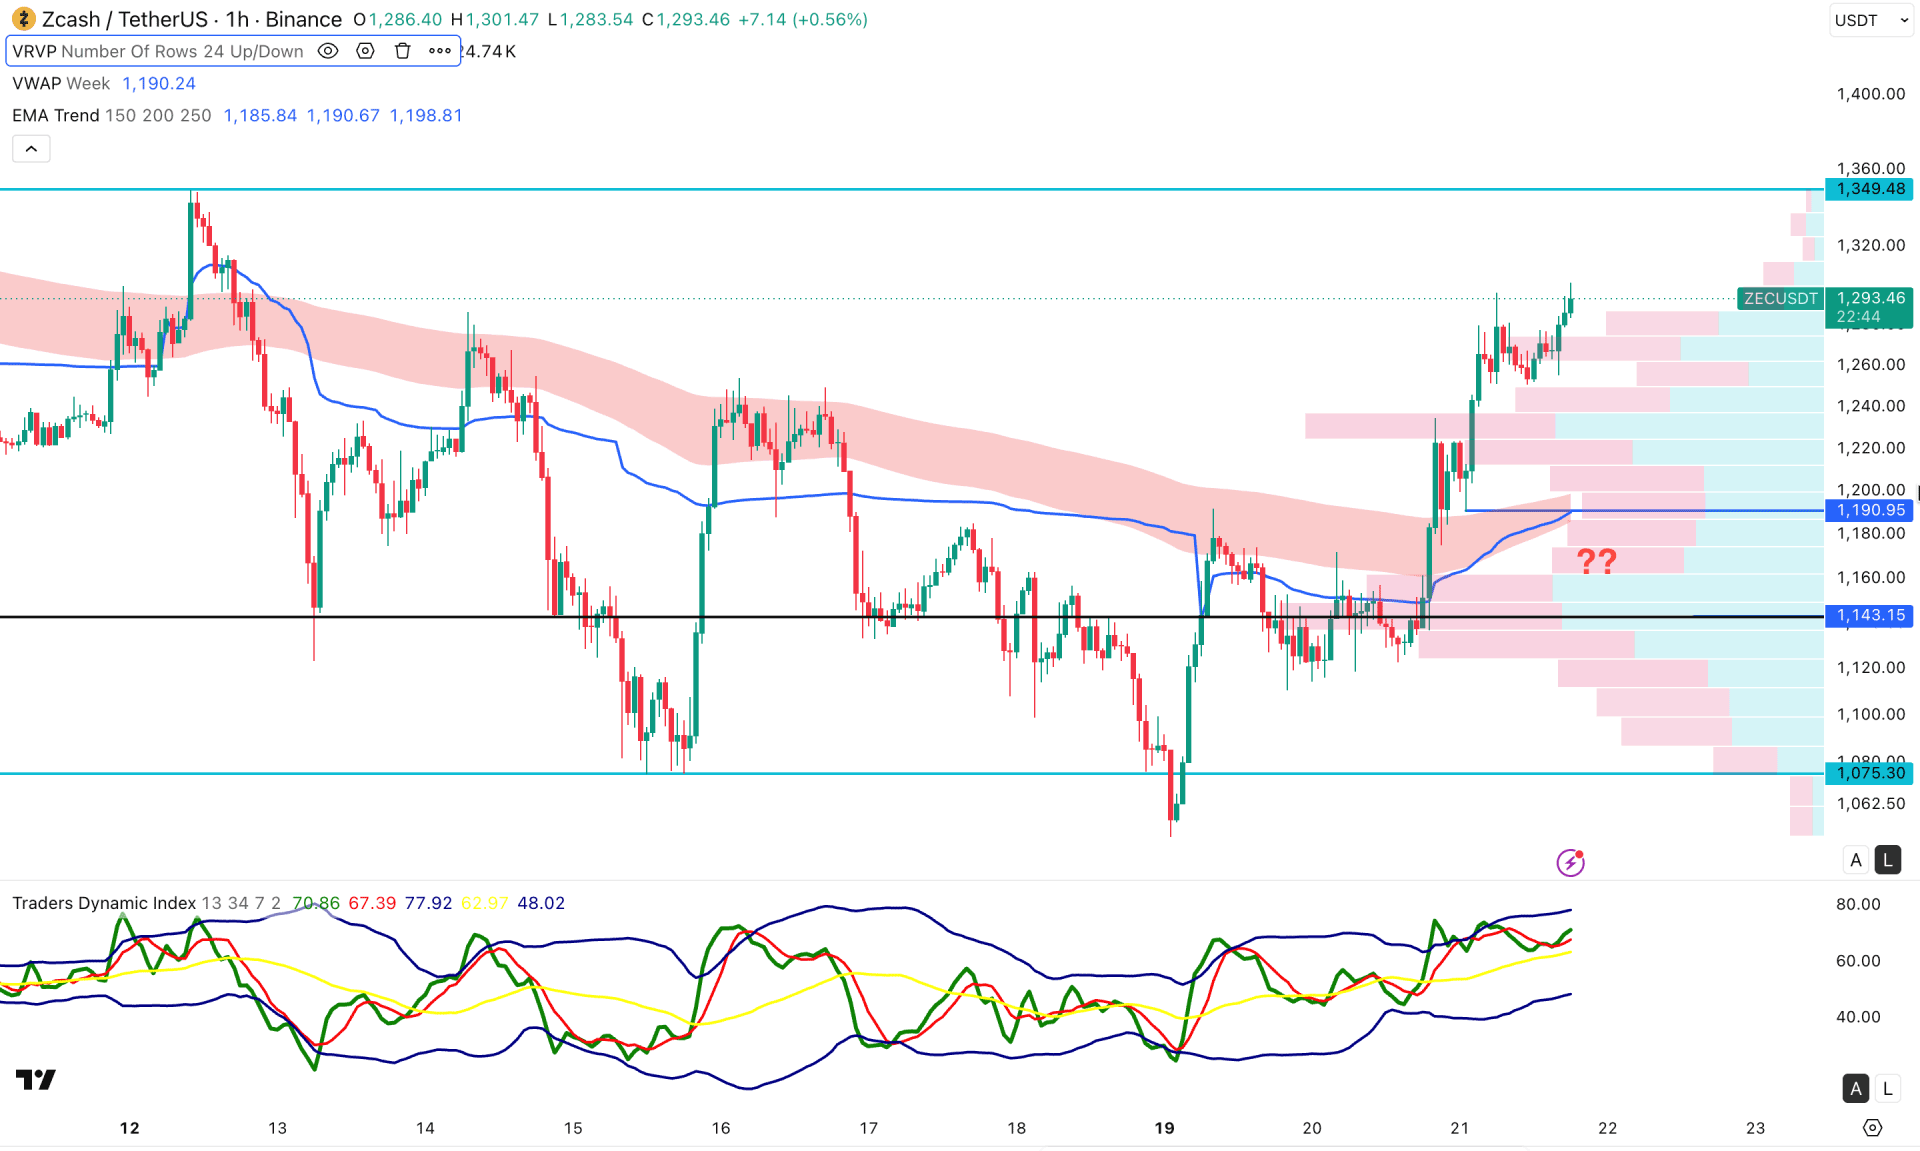
On the hourly timeframe, price is trading within a bullish wave after a liquidity sweep at the 1075.30 level. Moreover, a bullish pennant breakout is visible in the price action before creating a new swing low above 1252.69. This signals strong buying pressure, supported by a bullish EMA wave.
In the indicator window, the Traders Dynamic Index remains stable above the 50.00 line. This signals active buying in the market, with no sign of overextension.
Based on this outlook, the buying pressure remains valid as long as the dynamic VWAP level stays below the current price. The immediate resistance level to watch is 1349.48. Breaking this level could open room to test 1500.00.
Based on the overall market structure, ZEC/USDT is trading at a distance from the recent bottom formation, signaling a possible bullish continuation. Investors should closely monitor price action, as buying pressure could continue as long as the price stays above dynamic lines.


